


 |
| Gold V.1.3.1 signal Telegram Channel (English) |

AUDUSD: Bullish Breakout Near 16-Month High Signals Continued Upside Momentum
2026-01-28 @ 03:04
Over the past 24 to 48 hours, the AUD/USD pair traded between 0.6900 and 0.6980, closing at 0.6977 yesterday, near a 16-month high. Market sentiment remains cautious amid ongoing uncertainties around the Federal Reserve’s policy path and the upcoming Australian Consumer Price Index (CPI) release. This scenario has allowed the Australian dollar to stay strong, with the US dollar under pressure, creating a tight tug of war that keeps the pair elevated.
Recent market news highlights the Aussie’s robust performance driven by a return of risk appetite and solid Australian employment data. Market worries over the US central bank’s future rate hikes have ironically boosted the appeal of the Australian dollar, especially as US economic data has offered little to spark major bullish momentum. It’s akin to a defensive stock that draws investor attention during market turbulence for its blend of safety and growth potential.
Overall, AUD/USD has shown a firm upward trend over the past couple of days, supported by positive risk sentiment and Australian economic fundamentals. Going forward, ahead of the Fed meeting and Australian CPI data, the exchange rate may continue to oscillate upwards. Investors should stay tuned to these key events to adjust their positions accordingly.
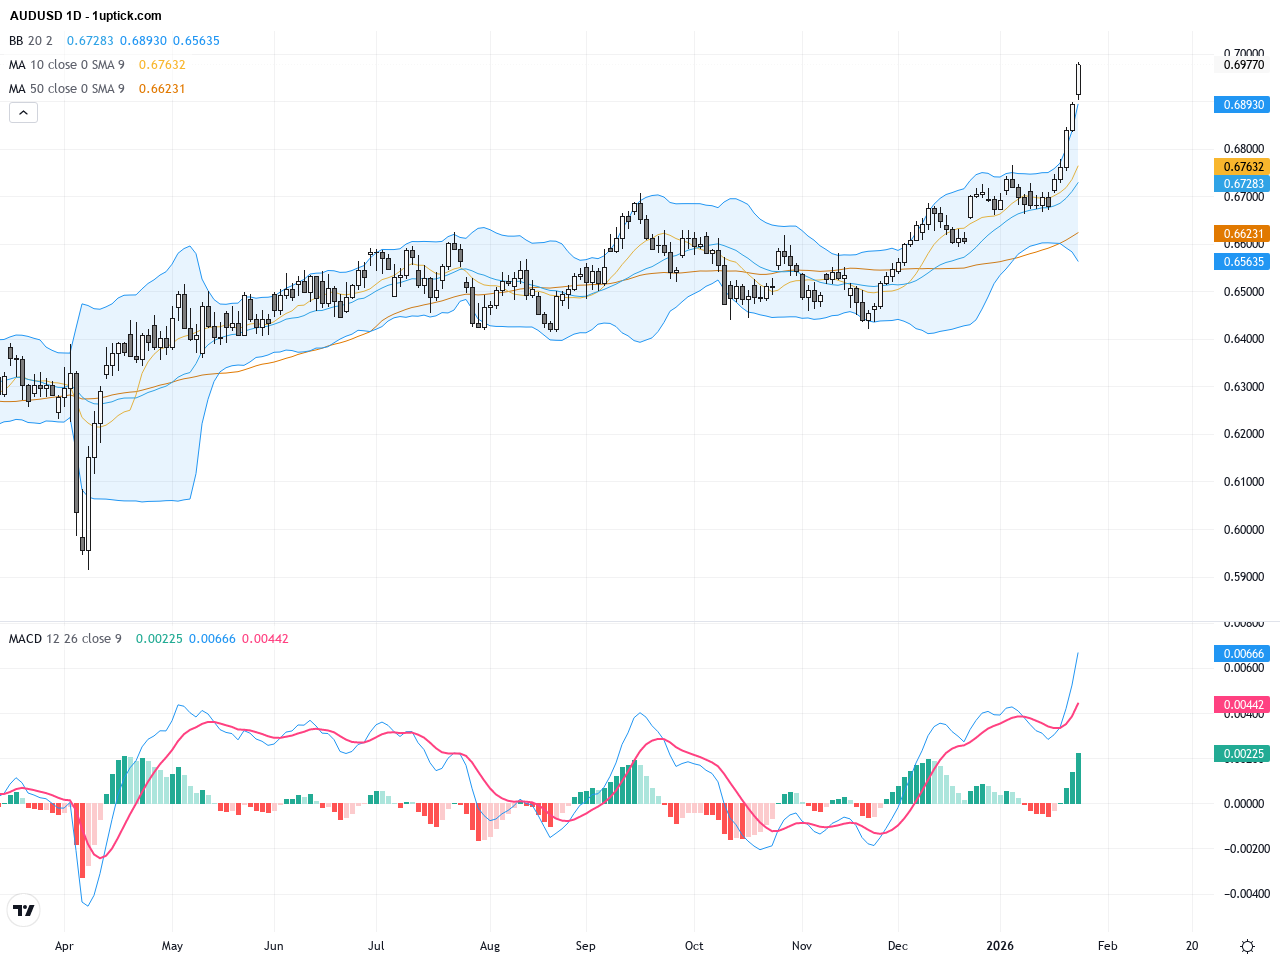
On the daily chart, AUDUSD shows a consistent uptrend since early 2026, with the latest close near the 0.6980 yearly high. The price stands well above the 50-day and 200-day moving averages (around 0.66355 and 0.65415 respectively), confirming a strong bullish momentum. Bollinger Bands are narrowing with price hugging the upper band, suggesting limited but upward-biased volatility. The MACD histogram remains positive and expanding above zero, reinforcing momentum. Overall, the daily technicals support a sustained bull trend.
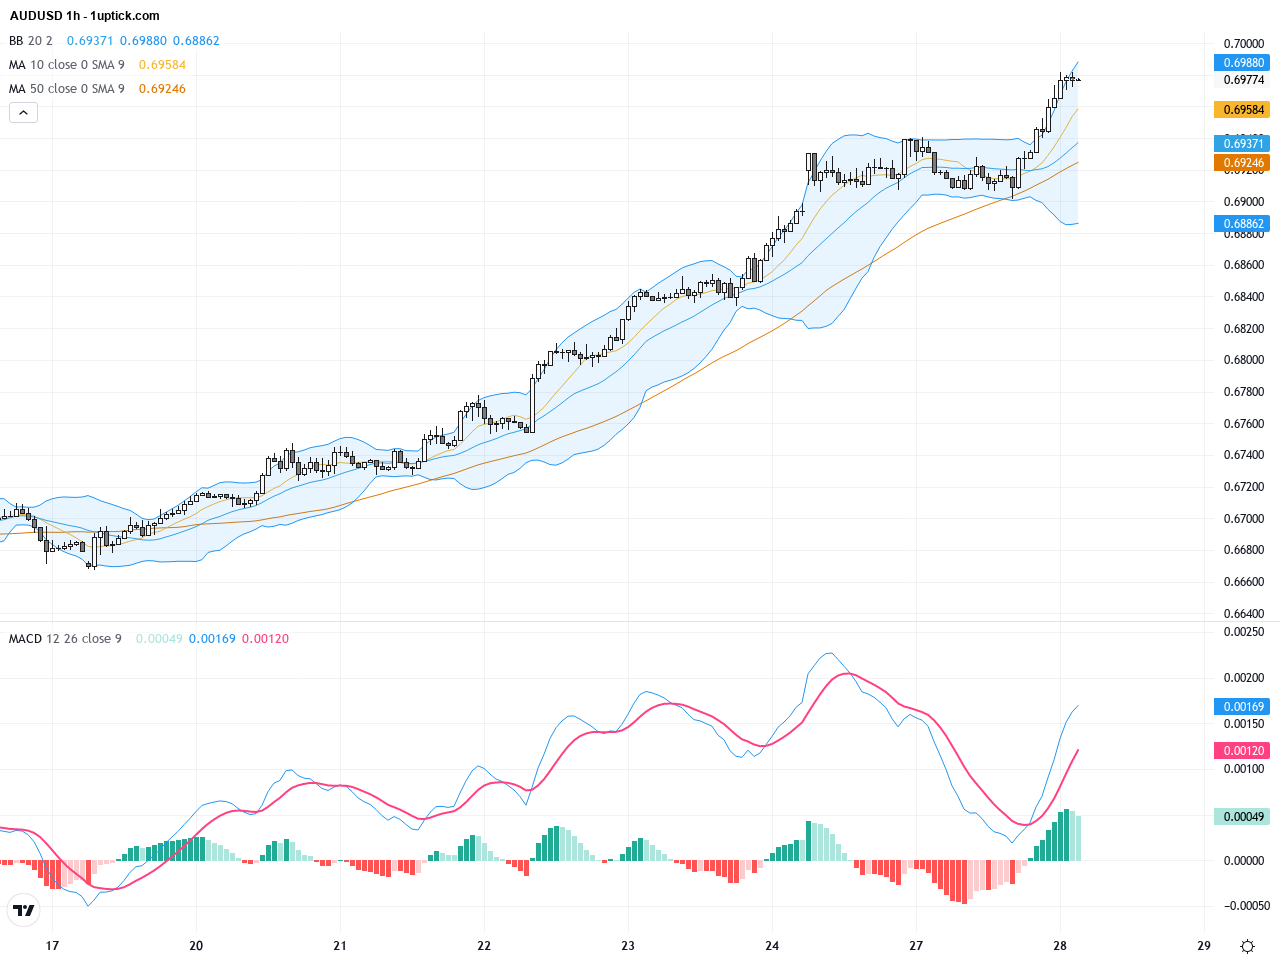
The hourly chart reveals a steady upwards consolidation over the past 3-5 days, with price fluctuating mostly between 0.6950 and 0.6980. Short-term moving averages (5 and 20 periods) form a bullish crossover, and price consistently bounces off the Bollinger Bands middle line. The MACD stays in positive territory with growing separation between signal lines, indicating strong short-term momentum. The recent bullish engulfing candle over the last 24 hours signals further upside potential.
Technical Trend: Trend Direction: Firm Bullish
Technical highlights show AUDUSD in a robust bullish phase with MACD daily buy signals and narrowing Bollinger Bands indicating a potential pause but upward-bias. The hourly chart’s recent bullish engulfing pattern coupled with a golden cross supports strong momentum continuation. Watch the 0.6900 psychological support and yesterday’s peak to determine breakout or possible pullbacks.There are no significant or directly relevant economic events for AUDUSD scheduled today. The main focus is on European unemployment rates and US consumer confidence indices, which have limited immediate impact on AUDUSD. However, traders should keep an eye on later US housing price indices and sentiment data, as better-than-expected figures could increase USD volatility and influence AUDUSD indirectly.
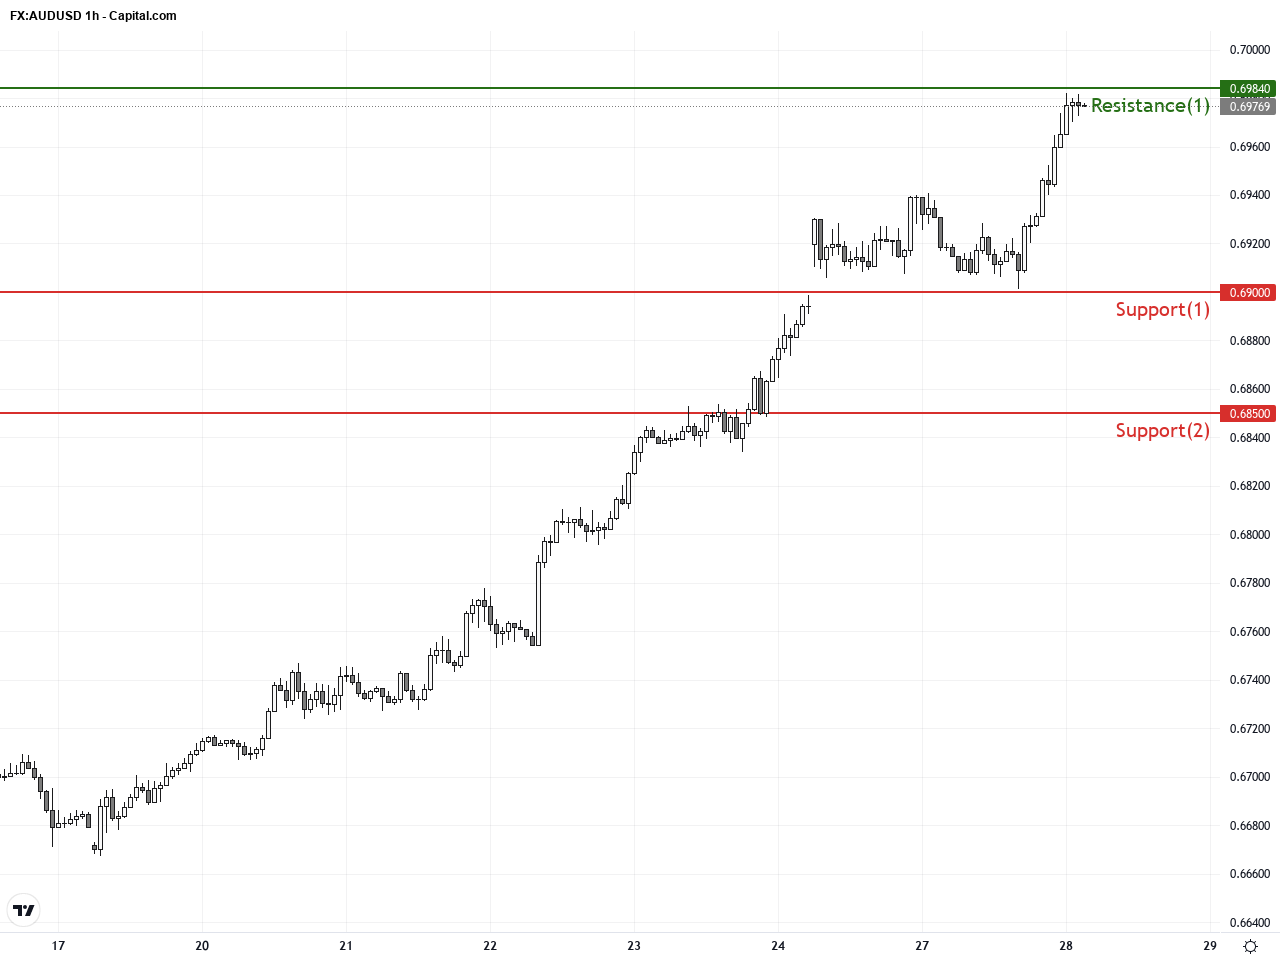
Resistance & Support
The above financial market data, quotes, charts, statistics, exchange rates, news, research, analysis, buy or sell ratings, financial education, and other information are for reference only. Before making any trades based on this information, you should consult independent professional advice to verify pricing data or obtain more detailed market information. 1uptick.com should not be regarded as soliciting any subscriber or visitor to execute any trade. You are solely responsible for all of your own trading decisions.