 |
| Gold V.1.3.1 signal Telegram Channel (English) |
AUDUSD: Cup-and-Handle Breakout Signals Strong Upside Momentum
2026-01-26 @ 06:01
Over the past 24 to 48 hours, the Australian Dollar against the US Dollar (AUD/USD) has surged significantly, closing at 0.69271—a yearly high in recent years. This strong rally has made the Aussie one of the best-performing currencies so far this year, with an intraday high matching the closing price and representing a more than 1.29% gain from the previous day’s close of 0.68388.
Multiple factors have driven this market movement: firstly, the US dollar has continued to weaken amid growing concerns over independence issues and the outlook for the US economy, adding selling pressure on the greenback. Meanwhile, robust fundamental data from Australia, especially in the private sector, have bolstered confidence in the AUD. Technical outlooks also support further gains, with expectations for AUD/USD to push past significant resistance near 0.69 and beyond.
From an investor’s perspective, the recent price surge reflects the market’s recognition of Australia’s economic resilience and the shift of risk appetite away from the US dollar toward the Australian dollar—a scenario akin to equity investors repositioning after digesting macro uncertainties, favoring assets with relative stability and growth potential. For those seeking diversified currency exposure, this rally in AUD offers a timely opportunity for strategic positioning.

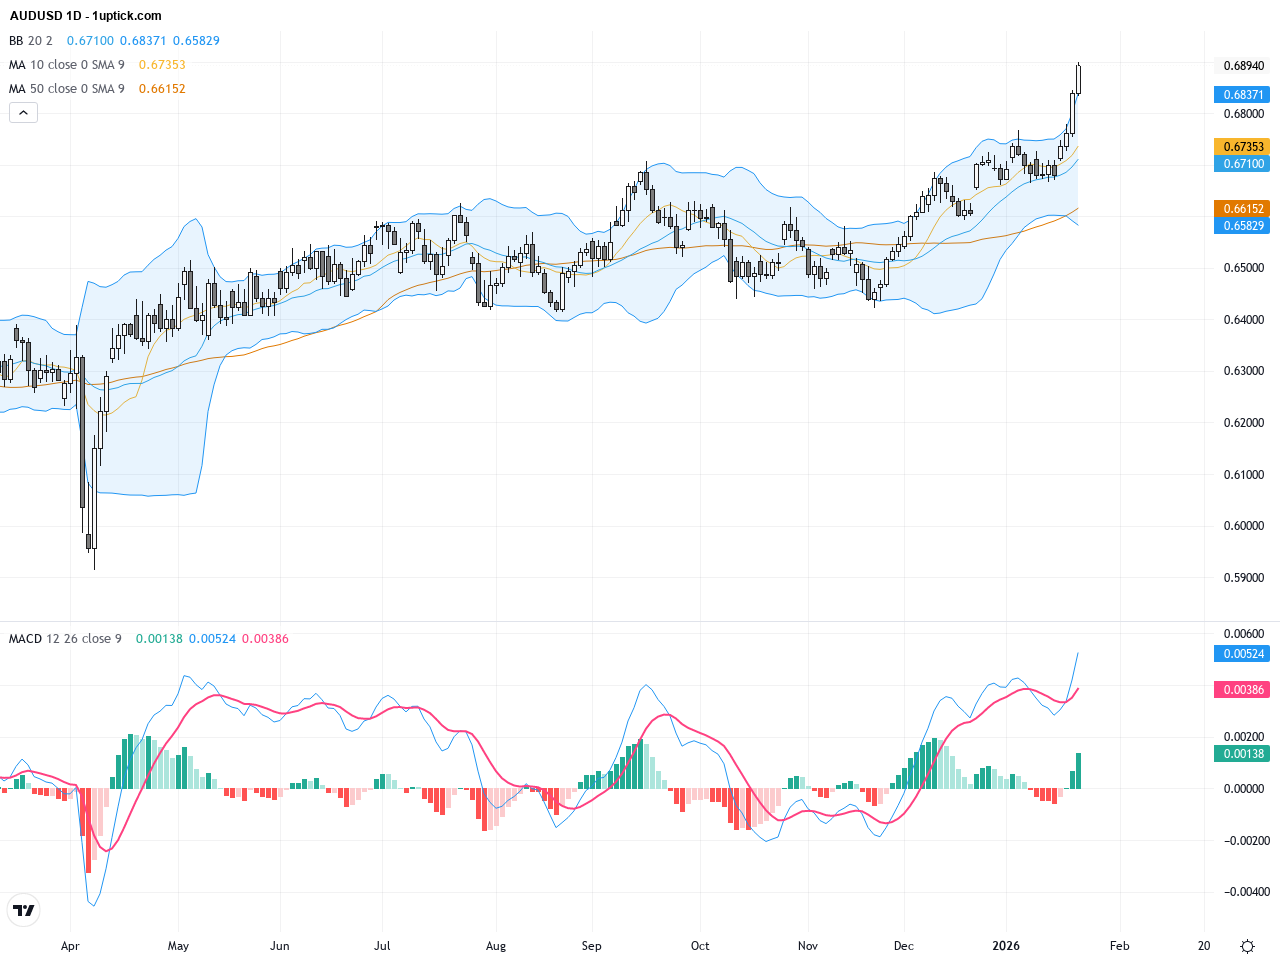
The daily chart reveals a sustained uptrend since the start of the year. Bollinger Bands are expanding upwards, signaling increased volatility with a bullish bias. Both the 50 and 200-day moving averages are aligned bullishly, and the price sits well above these averages. The MACD shows a strong bullish crossover, confirming accelerating momentum. Recently, the price broke the critical 0.6900 level, completing the cup-and-handle pattern’s handle breakout, which typically signals continued upward movement.

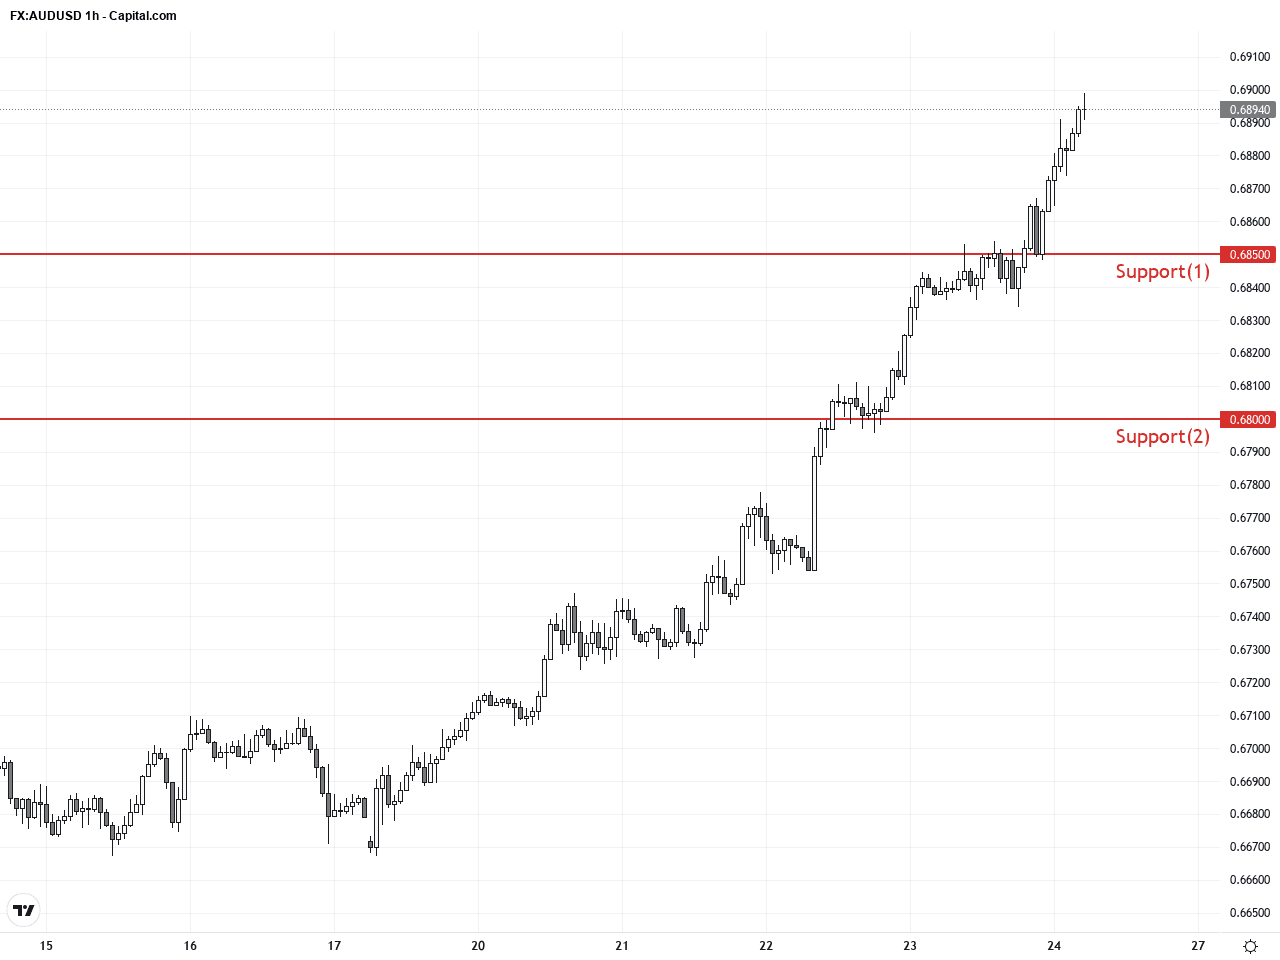
The hourly chart shows persistent short-term bullish momentum over the past 3 to 5 days, though volatility has increased. Price remains above the middle Bollinger Band and repeatedly tests the upper band, indicative of sustained buying pressure. The MACD is trending higher, and the RSI stays below the overbought zone near 65, suggesting room for more gains. A recent bullish engulfing candlestick pattern implies probable upward continuation over the next 24 hours.
Technical Trend: The trend is decisively bullish with a steady upward trajectory.
AUDUSD is in a confirmed bullish trend with clear technical breakouts. The MACD bullish crossover combined with expanding Bollinger Bands and the cup-and-handle breakout reinforce upward momentum. On the short-term hourly chart, a bullish engulfing pattern strengthens the immediate bullish case. Support at 0.6800 is crucial; a breach could trigger short-term pullbacks, but overall medium- to short-term bias remains positive.There are no significant or directly relevant economic events scheduled today that would impact AUDUSD. The focus remains on technical developments and recent strong Australian economic data. Traders should watch price action closely for technical signals.
Resistance & Support
The above financial market data, quotes, charts, statistics, exchange rates, news, research, analysis, buy or sell ratings, financial education, and other information are for reference only. Before making any trades based on this information, you should consult independent professional advice to verify pricing data or obtain more detailed market information. 1uptick.com should not be regarded as soliciting any subscriber or visitor to execute any trade. You are solely responsible for all of your own trading decisions.