 |
| Gold V.1.3.1 signal Telegram Channel (English) |
AUDUSD Steadies Around 0.6700 as Technical and Fundamental Factors Align
2026-01-19 @ 06:01
Over the past 24 to 48 hours, the Australian Dollar against the US Dollar (AUD/USD) demonstrated noticeable stability with a slight uptick, hovering around 0.6700 after closing yesterday at 0.6699. The market saw a cooling in the US Dollar’s upward momentum, allowing the Aussie to appreciate for the second consecutive day. This strengthening was closely linked to a rebound in global equities, which boosted investor confidence and reduced demand for the US Dollar as a safe haven.
The cautious tone from the Reserve Bank of Australia (RBA) has also supported the Aussie, with markets interpreting RBA’s measured approach as a factor damping expectations for aggressive US Dollar strength. Recent softer US economic data, particularly weaker consumer confidence figures, have kept the Dollar on the defensive and helped AUD/USD hold firm around the 0.6700 level. For the average investor, this suggests that amidst ongoing global uncertainties and geopolitical tensions, the Australian Dollar remains a relatively stable and attractive currency due to Australia’s economic recovery and commodity export outlook.

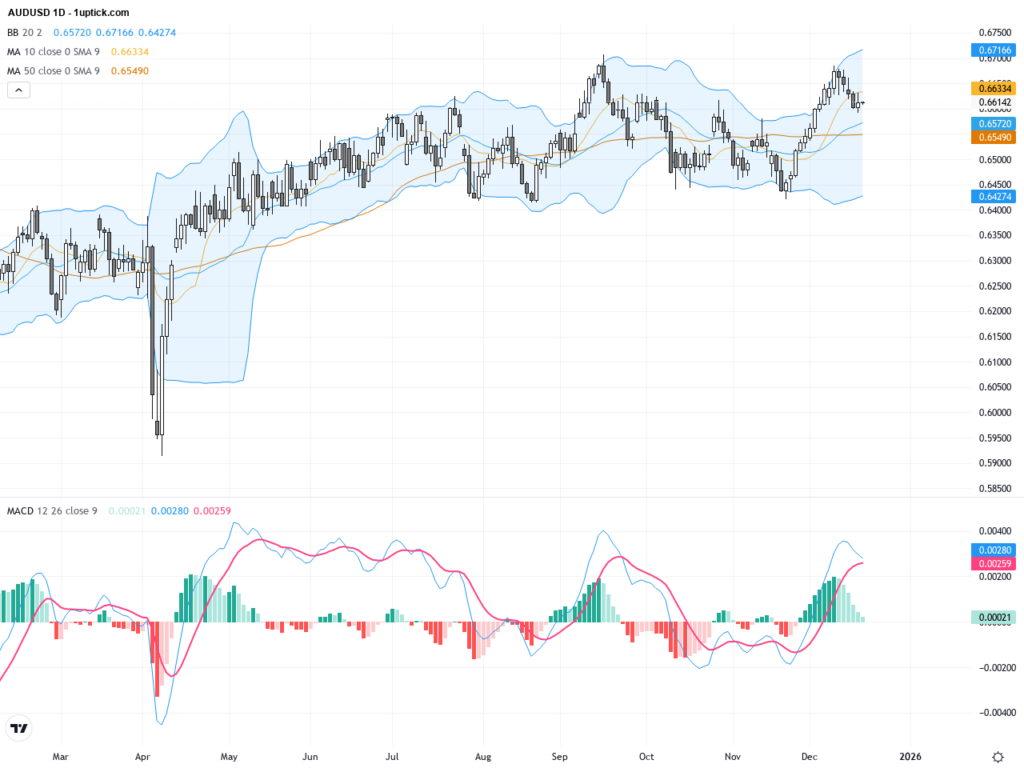
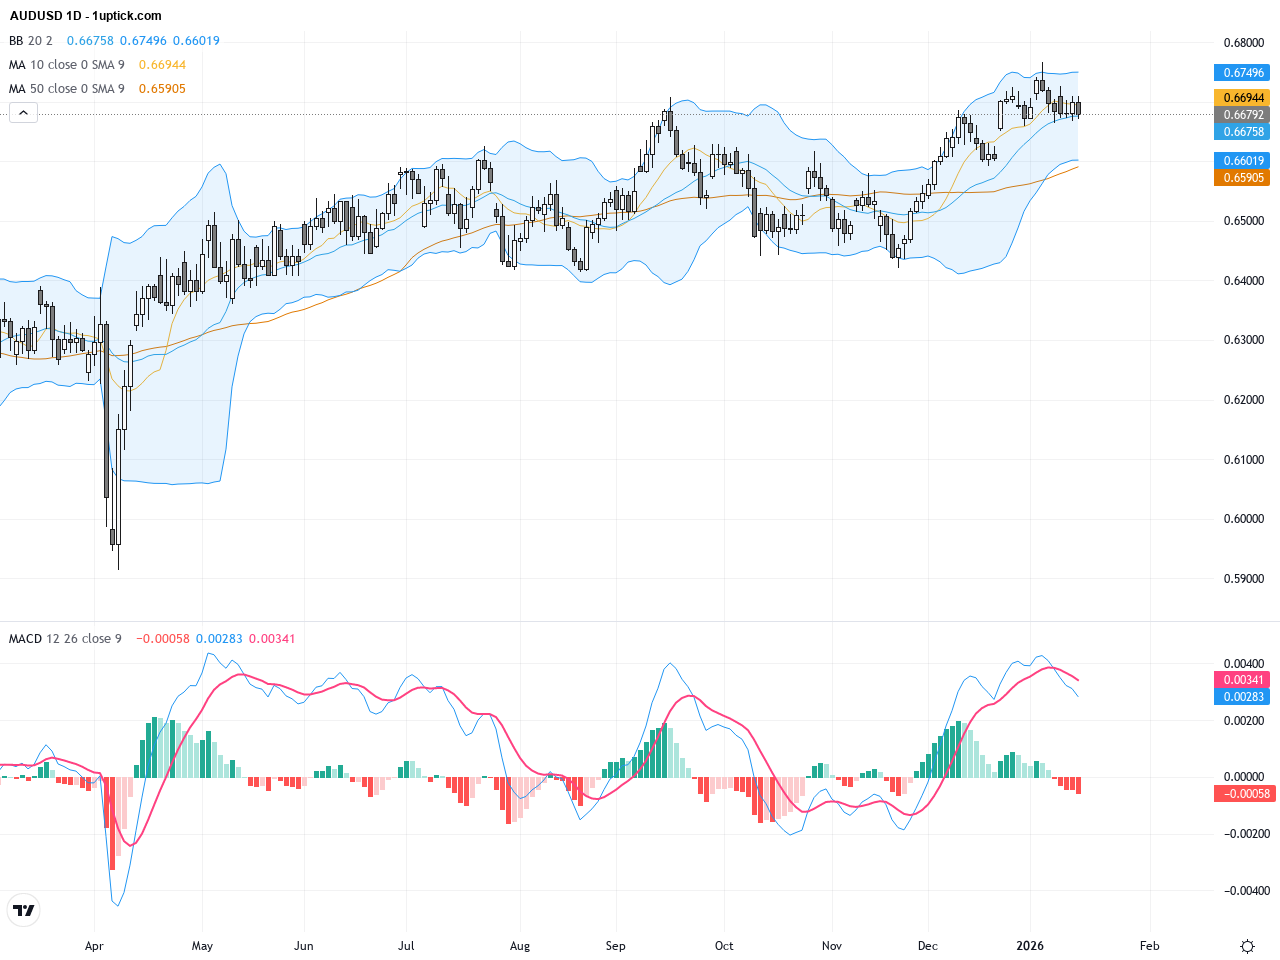
The daily chart illustrates a steady upward trend for AUDUSD, with price action firmly above the 50-day moving average (~0.6630) and 200-day moving average (~0.6556), indicating a bullish baseline. The Bollinger Bands are narrowing, signaling a potential upcoming breakout. The MACD remains positive with the signal line above zero, reinforcing the ongoing bullish momentum. No immediate signs of reversal are visible, with the longer-term trend intact.
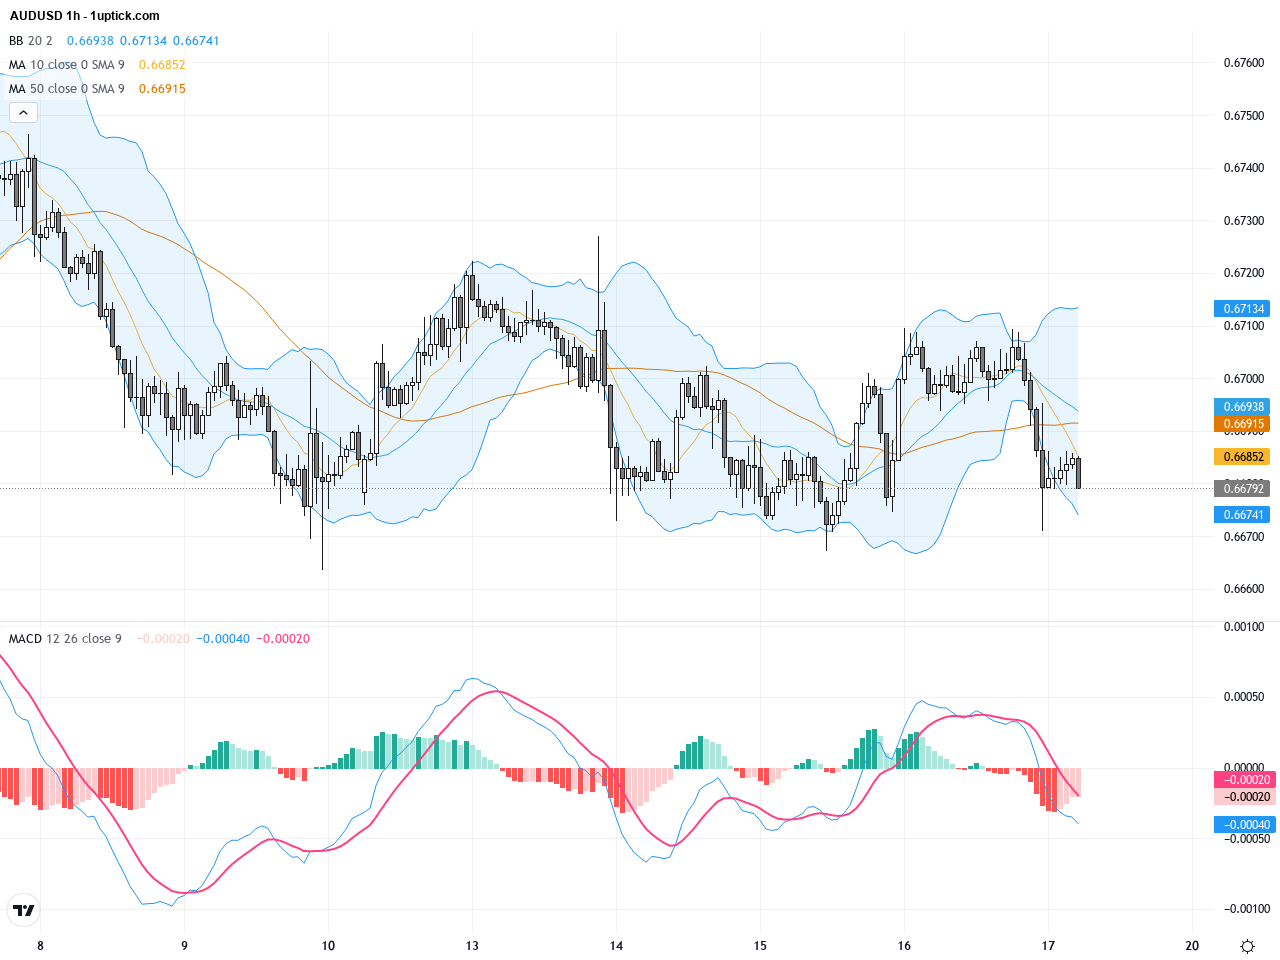
On the hourly chart, price has been oscillating between 0.6670 and 0.6710 over the last 3-5 days. The 50-period and 20-period moving averages remain in a bullish alignment, with prices mostly trading above these averages. A recent minor MACD golden cross and expanding Bollinger Bands reveal short-term momentum pickup. The formation of a hanging man candlestick at support underlines solid price floor and potential for near-term upside movement.
Technical Trend: Cautiously bullish consolidation trend
With the MACD maintaining bullish momentum on the daily chart and a short-term golden cross forming, AUDUSD shows readiness for a rebound. Bollinger Band contraction suggests volatility expansion is imminent. The recent hanging man candlestick pattern near critical support further confirms a strong floor, limiting downside risk. Traders should watch for a decisive break above 0.6700 to confirm the next leg higher while managing risk appropriately.There are no major economic releases or events scheduled today (GMT+1) that will directly impact AUDUSD. Traders should focus on technical signals and anticipate future US economic data for direction, as AUDUSD price action is currently more influenced by risk sentiment and US market developments.
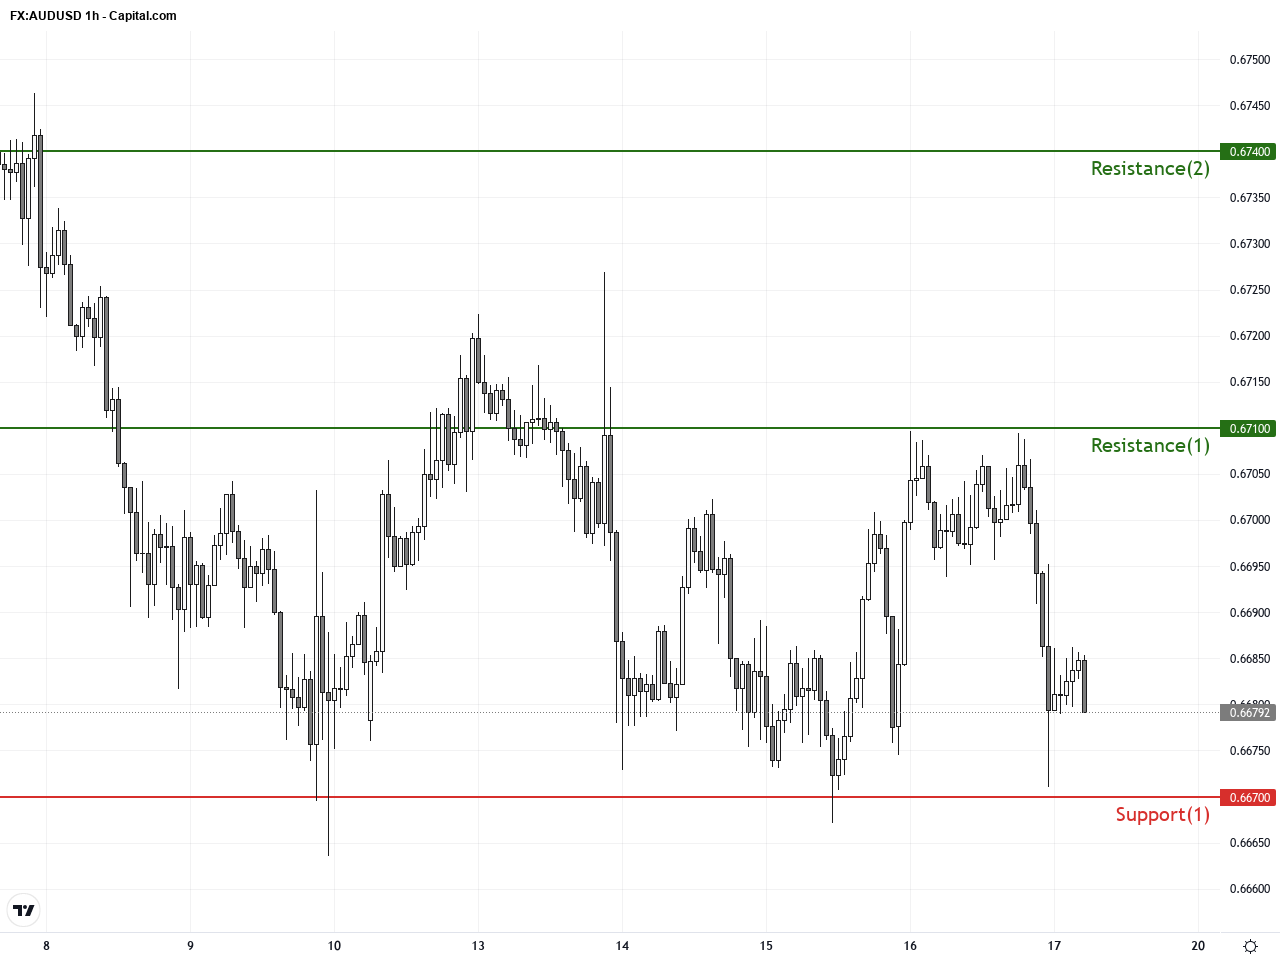
Resistance & Support
The above financial market data, quotes, charts, statistics, exchange rates, news, research, analysis, buy or sell ratings, financial education, and other information are for reference only. Before making any trades based on this information, you should consult independent professional advice to verify pricing data or obtain more detailed market information. 1uptick.com should not be regarded as soliciting any subscriber or visitor to execute any trade. You are solely responsible for all of your own trading decisions.