


 |
| Gold V.1.3.1 signal Telegram Channel (English) |

AUDUSD: Technical Patterns Signal Key Support Bounce Amid Fundamental Uncertainty
2026-01-16 @ 06:01
Over the past 24 to 48 hours, the AUD/USD pair traded within a tight range of approximately 0.6680 to 0.6709, closing yesterday near 0.6699. The market showed cautious behavior, influenced by multiple macroeconomic factors resulting in subdued price movement. Recent market news highlighting that the “GBP to AUD slipped as risk appetite lifts AUD” indicates that a rise in risk appetite is driving inflows into the Australian dollar, supporting its steadiness within this range.
At the same time, easing Australian inflation expectations and the release of China’s trade data presented mixed signals for the AUD. While the inflation data put short-term pressure leading to minor dips, positive trade data from China provided fundamental support. Amid uncertainty about U.S. Federal Reserve policies and ongoing geopolitical tensions, the USD remained under pressure, allowing the AUD to maintain relative strength.
For the average investor, the recent fluctuations in the Australian dollar reflect shifting market sentiment within a backdrop of global economic instability and unclear Fed policy direction. Increased risk appetite boosts demand for the AUD, while inflation worries and data volatility cap strong moves. In the short term, the AUD/USD is likely to continue oscillating within the 0.666 to 0.671 range.
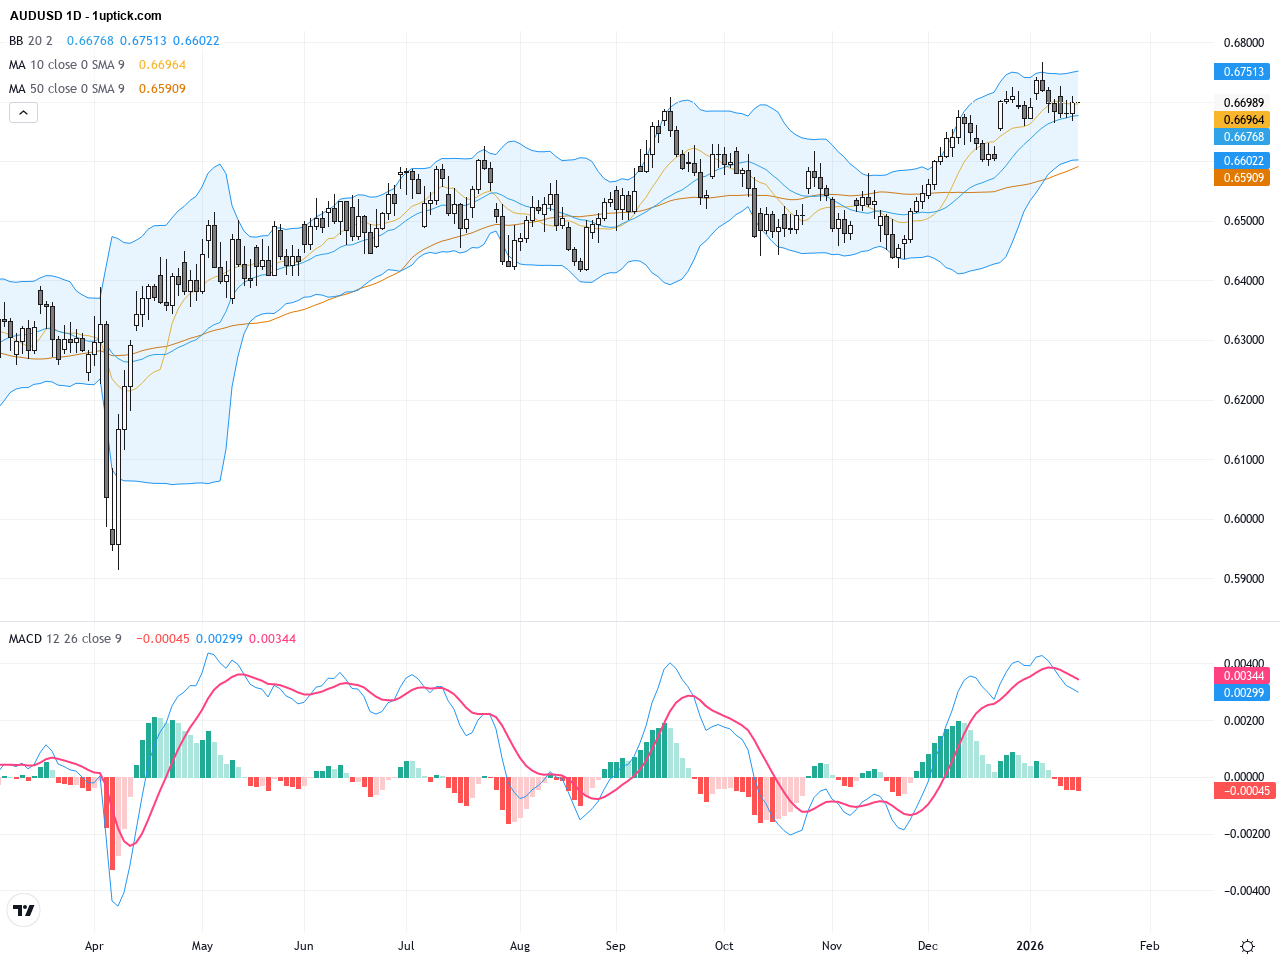
The daily chart reveals a mild uptrend, with AUDUSD gradually recovering from early-year lows toward the 0.67 area while staying above the 50 and 200-day moving averages. Bollinger Bands suggest price is oscillating near its mid-band, with the 9-day EMA around 0.67 serving as resistance. MACD histogram bars are shrinking, signaling that bullish momentum is fading but not yet reversing.

On the hourly chart over the last 3-5 days, price action shows a consolidative bullish bias. Short-term moving averages (9 and 21 EMA) remain aligned in a bullish order, but prices are tightly bound between 0.6680 and 0.6700, indicating indecision. The narrowing Bollinger Bands suggest reduced volatility, and the MACD is hovering near zero, implying the market awaits a catalyst. A minor symmetrical triangle is forming, hinting at an impending directional breakout.
Technical Trend: Current trend is cautiously sideways to slightly bullish, with decreasing volatility and awaiting a decisive breakout.
Technically, AUDUSD is in a cautious consolidation, approaching the 9-day EMA resistance zone intraday. The daily MACD momentum continues to wane, suggesting a possible near-term pullback if the lower support near 0.6667 is tested. The hourly formation of a triangle pattern could precede a significant breakout, with volume and momentum indicators critical for confirmation. Traders should employ tight stop losses and monitor global risk sentiment closely.Today’s GMT+1 economic calendar shows no major data directly impacting AUDUSD, with no significant Australian reports. However, US data releases at 14:30 GMT+1, including the Philadelphia Fed and New York Empire State manufacturing indexes, have significantly beaten expectations, potentially strengthening the USD and pressuring AUDUSD. Additionally, Chinese credit and money supply figures for December exceeded forecasts, offering support to the AUD. Thus, indirect factors from US and China data will likely dominate price reaction today.
Resistance & Support

The above financial market data, quotes, charts, statistics, exchange rates, news, research, analysis, buy or sell ratings, financial education, and other information are for reference only. Before making any trades based on this information, you should consult independent professional advice to verify pricing data or obtain more detailed market information. 1uptick.com should not be regarded as soliciting any subscriber or visitor to execute any trade. You are solely responsible for all of your own trading decisions.