


 |
| Gold V.1.3.1 signal Telegram Channel (English) |

EURUSD: Approaching Final Triangle Leg – Key Resistance Levels to Watch
2026-01-07 @ 09:01
Over the past 24 to 48 hours, the EUR/USD pair experienced notable volatility, initially edging slightly above yesterday’s closing price of 1.16916 before pulling back to hover around the 1.17 level currently. This price movement reflects growing market concerns about the Eurozone’s economic slowdown, particularly highlighted by Germany’s inflation retreating to 1.8%, which dampened confidence in the euro.
Meanwhile, mixed economic data from the United States and anticipation of the upcoming US employment report have kept the dollar relatively strong, adding dual pressure on the EUR/USD pair. Market interpretations of divergent policy signals from the Eurozone and the Federal Reserve have caused the pair to oscillate near the 1.17 range, with traders awaiting clearer directional cues.
To give a relatable analogy, it’s like a closely contested game where fans are holding their breath at a critical juncture, waiting for a decisive score or a turnaround. The short-term fluctuation in EUR/USD truly mirrors this sense of anticipation and uncertainty.
In summary, the recent market news highlighting Eurozone economic deceleration and unclear US policy direction are the main drivers behind the EUR/USD price swings. Investors and traders should closely monitor upcoming Eurozone data releases and the US non-farm payrolls report, as these will be key indicators shaping the next phase of market movement.
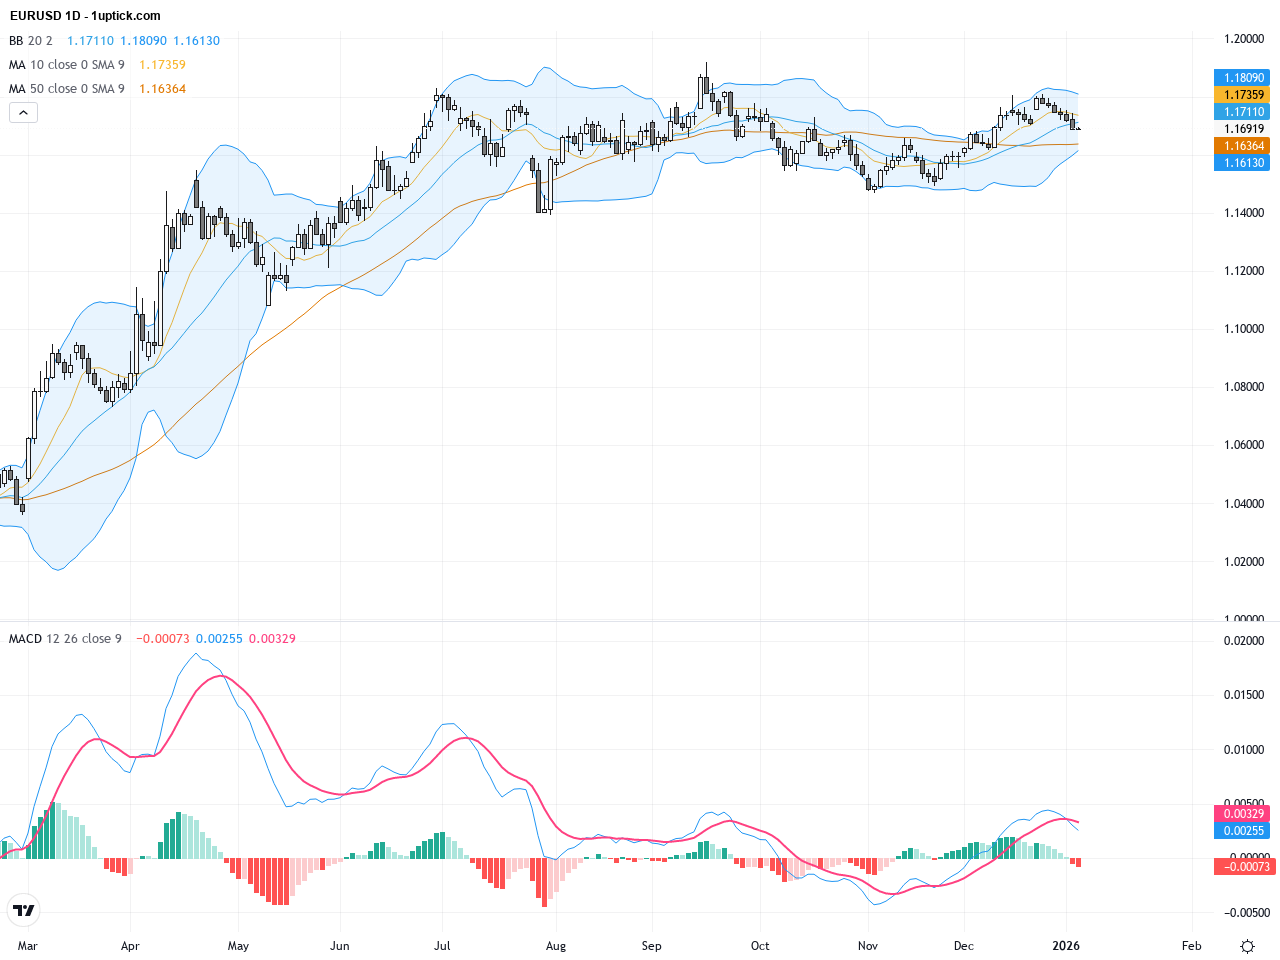
The daily chart reveals EURUSD moving within a tightening range between 1.16 and 1.18, forming a converging triangle pattern. Bollinger Bands compress, and the price is near the mid-band. The 50-day and 200-day moving averages maintain a bullish alignment, supporting a medium-term uptrend. MACD histogram stays positive and the crossover between the MACD lines suggests potential bullish momentum building up.
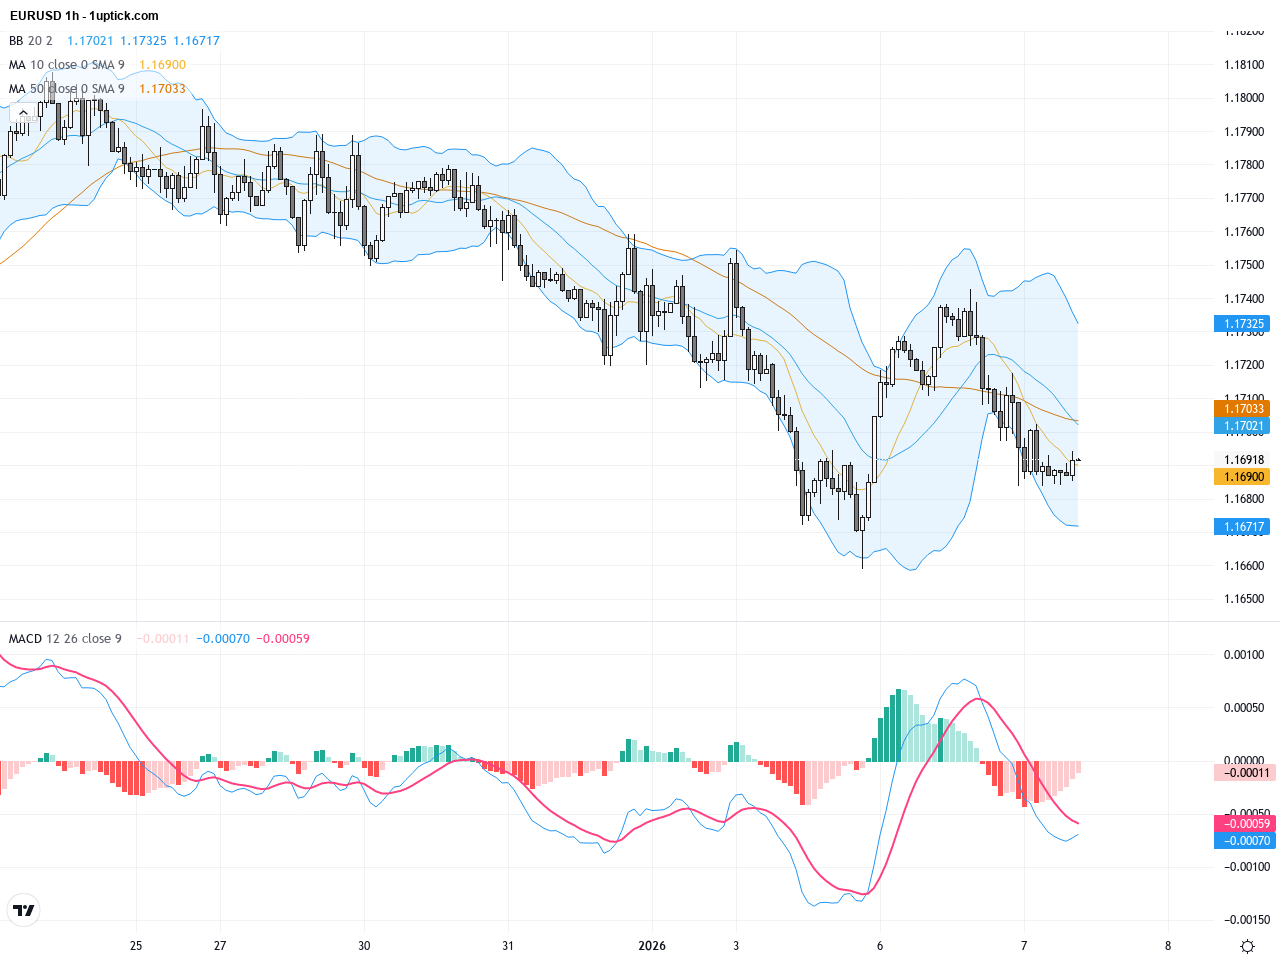
In the last 3-5 days on the hourly chart, EURUSD shows narrow-range consolidation within a clear triangular squeeze. Bollinger Bands are tightening, and MACD indicates divergence. The pair oscillates between the 50 and 200 SMA. A recent hammer candlestick signals weakening selling pressure, which might provoke a short-term rebound.
Technical Trend: EURUSD currently trends with cautious sideways consolidation, maintaining a mild bullish bias over the medium term.
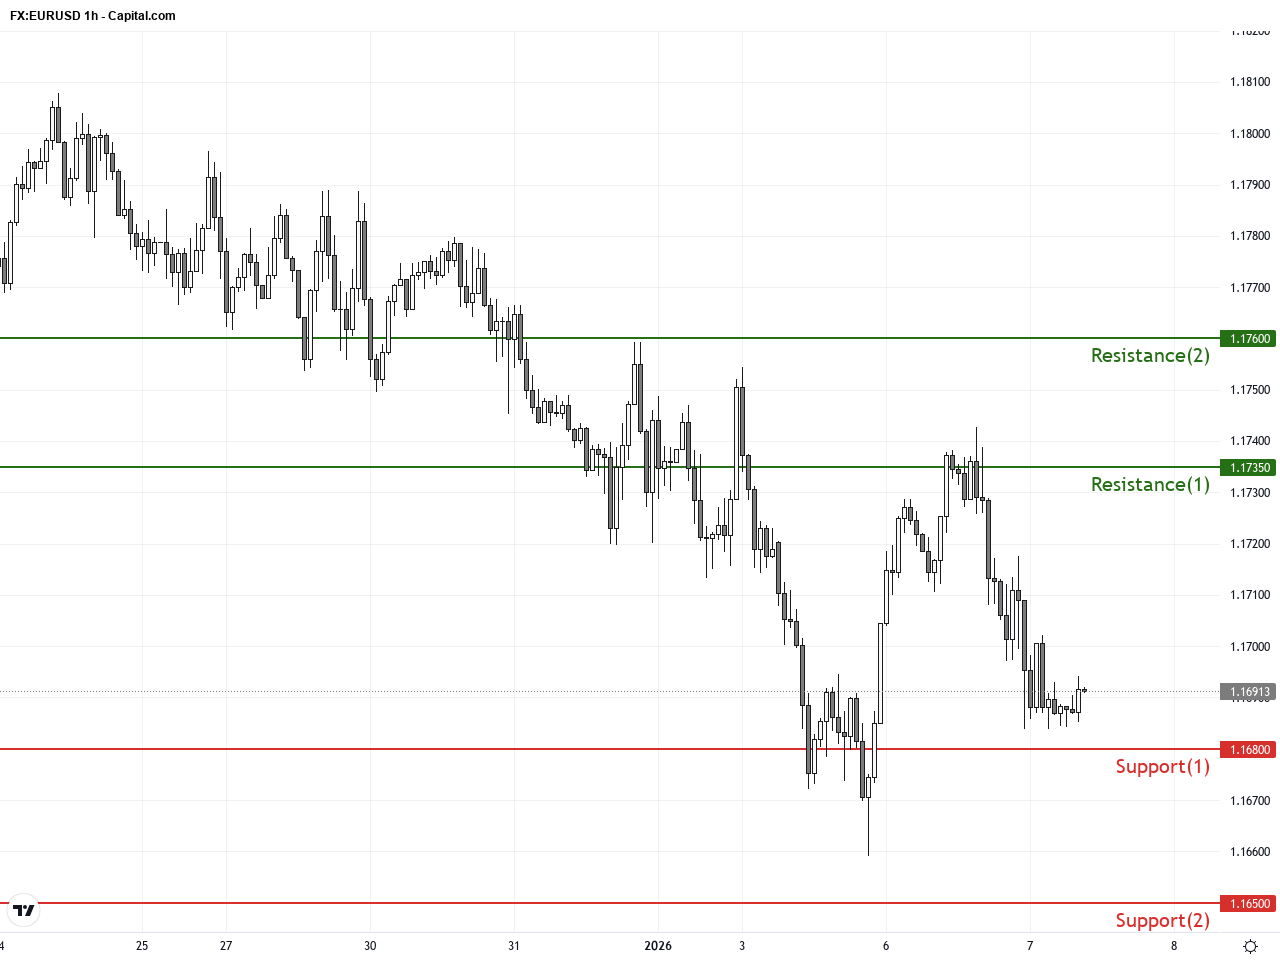
Technically, EURUSD is forming a classic daily triangle consolidation, typically preceding a breakout. The hammer candlestick and MACD divergence on the hourly chart provide short-term bullish signals. Key levels to watch are resistance near 1.1700 and support around 1.1650. This phase demands vigilance as a clear directional move may unfold soon.Today’s European economic releases include German retail sales, consumer price indices, and EU harmonized inflation data, which are central to EURUSD volatility. The US will release crucial data such as the ISM non-manufacturing index and durable goods orders at 16:00 GMT+1, also influencing the pair’s short-term movement. Traders should closely monitor these events for possible catalysts.
Resistance & Support
The above financial market data, quotes, charts, statistics, exchange rates, news, research, analysis, buy or sell ratings, financial education, and other information are for reference only. Before making any trades based on this information, you should consult independent professional advice to verify pricing data or obtain more detailed market information. 1uptick.com should not be regarded as soliciting any subscriber or visitor to execute any trade. You are solely responsible for all of your own trading decisions.