


 |
| Gold V.1.3.1 signal Telegram Channel (English) |

EURUSD Technical Analysis: 1.18 Resistance Holds, Short-Term Consolidation Expected
2026-01-05 @ 17:29
In the past 24 to 48 hours, EUR/USD showed a continued downward trend, trading around 1.17 based on yesterday’s closing price of 1.1705, failing to break the significant 1.18 resistance level. Disappointing Eurozone manufacturing data further fueled concerns over the region’s economic slowdown, directly weighing on the euro.
Meanwhile, the dollar strengthened as bond yields rose, with the dollar index rising by 0.15%. The decline in both the euro and the yen supported the dollar’s gains, while investors remained focused on upcoming US manufacturing PMI data, which is influencing near-term dollar movements.
For the average investor, it’s like the euro is hitting an unbreakable wall, while the dollar accelerates by leveraging economic data and bond market momentum, creating a widening gap. The market shifts its investment stance accordingly, reflecting current risk sentiment and the economic fundamentals at play.
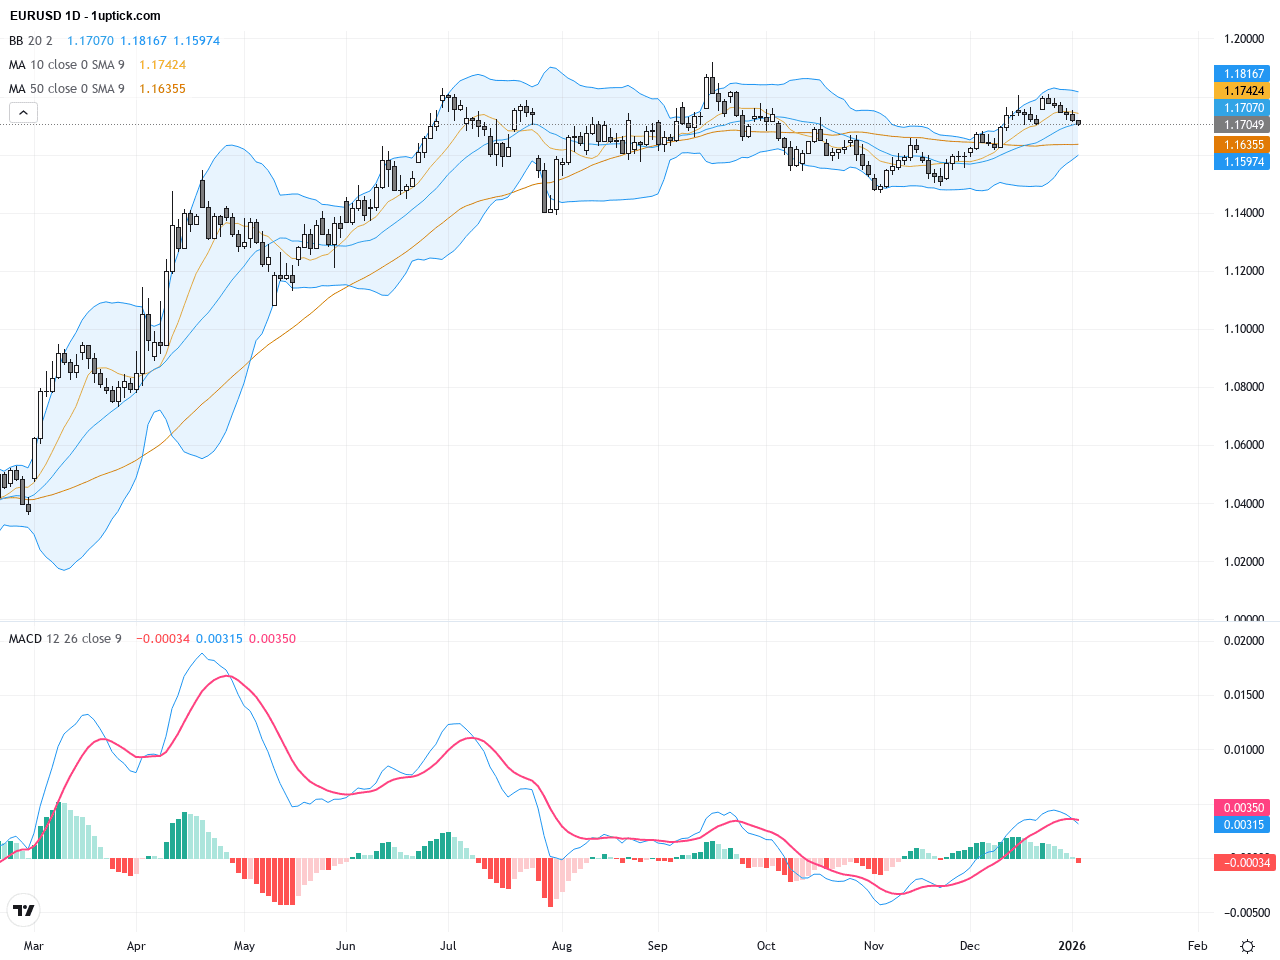
The daily chart shows EURUSD trending upwards slowly since late last year but facing strong resistance around 1.18 to 1.19, leading to pullbacks. The price is currently above the 50-day moving average (~1.1656) and supported by the 200-day moving average (~1.1625). The narrowing Bollinger Bands indicate decreased volatility, while MACD remains bearish, signaling strong resistance above and a trend leaning towards consolidation with a weak bias.
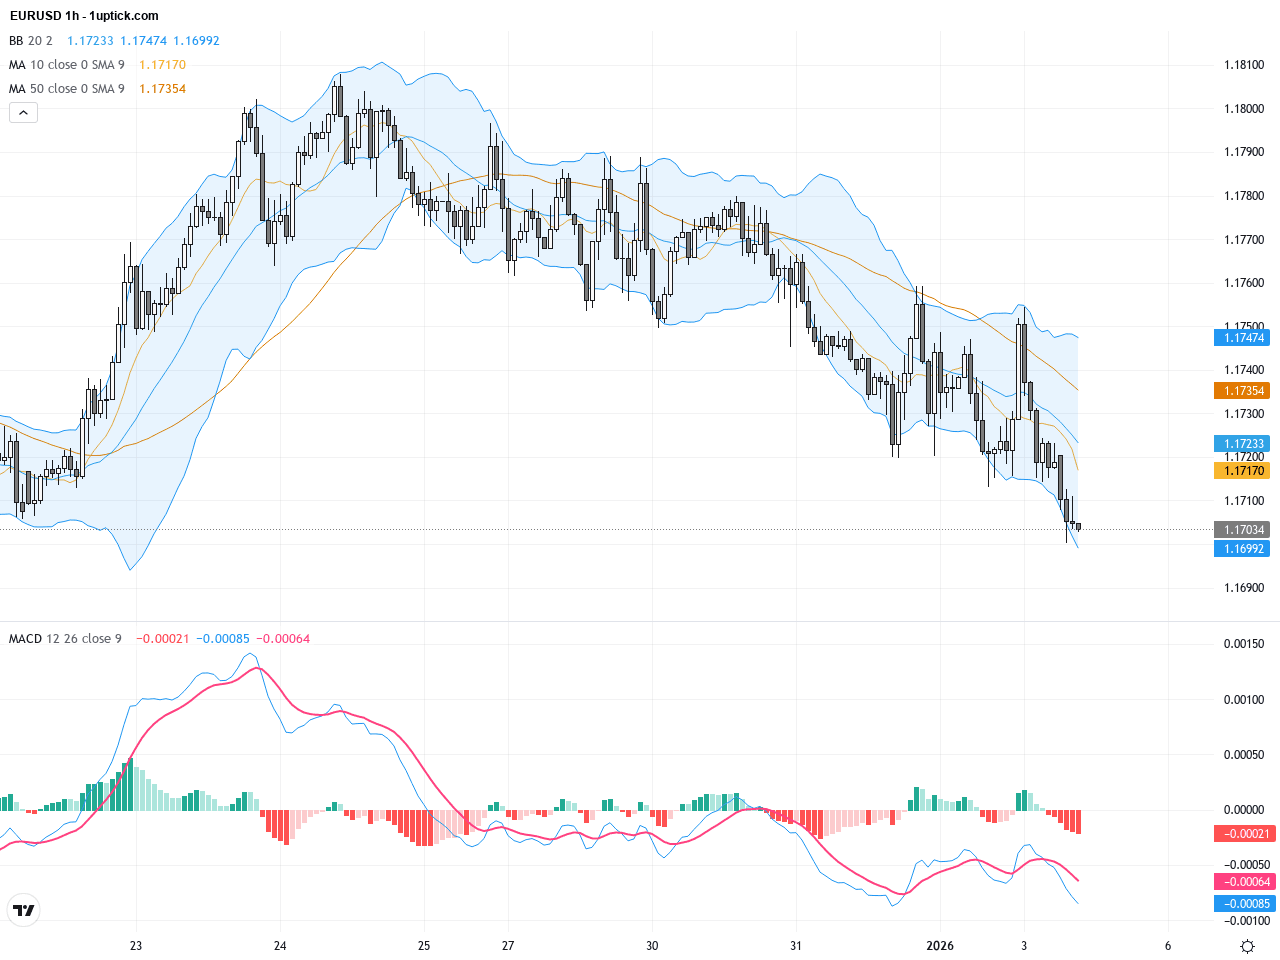
Hourly chart over the past five days reveals a short-term downtrend with EURUSD oscillating near the middle Bollinger Band. Short-term moving averages have formed a bearish crossover, indicating selling pressure. MACD histogram stays negative without clear signs of recovery, and the compressed Bollinger Bands suggest a continuation of range-bound trading. Key focus remains on the psychological support at 1.1700 in the short term.
Technical Trend: Current trend is cautiously consolidating with a slight downward bias, lacking a clear short-term direction but generally weak.
Technically, EURUSD is testing critical multi-moving average support near the 1.1700 psychological level. MACD and RSI show weak momentum with short-term upside pressure but the pair remains within a consolidation phase. A potential low-level triangle pattern could lead to further downside if support breaks. Recent large bearish candlesticks and absence of reversal engulfing patterns suggest traders should be cautious about aggressive longs. Price remains sensitive to fundamental news.Key economic releases today include the EU Sentix Index and the US ISM Manufacturing Index, both scheduled after 16:00 CET (23:00 HKT), which could affect market moves in the evening session. Asian and European data such as Japan’s Manufacturing PMI (01:30 CET) and China’s Services PMI (02:45 CET) have limited immediate impact on EURUSD. Overall, there are no major direct events during the day to immediately drive EURUSD volatility, but ongoing economic data continue to reflect underlying growth concerns.
Resistance & Support

The above financial market data, quotes, charts, statistics, exchange rates, news, research, analysis, buy or sell ratings, financial education, and other information are for reference only. Before making any trades based on this information, you should consult independent professional advice to verify pricing data or obtain more detailed market information. 1uptick.com should not be regarded as soliciting any subscriber or visitor to execute any trade. You are solely responsible for all of your own trading decisions.
Latest Technical Analysis
Latest Insightz