


 |
| Gold V.1.3.1 signal Telegram Channel (English) |

EURUSD Technical Pressure Intensifies as Strong US Economic Data Propels Dollar Higher
2026-01-09 @ 09:02
Over the past 24 to 48 hours, EUR/USD continued its downward trend, closing yesterday at 1.16538, slightly lower than the previous day. Market volatility was primarily driven by a stronger U.S. dollar buoyed by solid recent economic data from the United States. The Dollar Index (DXY) hit a four-week high, reflecting rising market confidence in the U.S. economic outlook. Robust employment figures and better-than-expected inflation data increased demand for the dollar, pushing EUR/USD below the 1.17 level and causing it to pressure the pair down for the third consecutive session.
From the news perspective, strong U.S. economic releases overshadowed weaker signals from the Eurozone. Euro area inflation slowed from 2.1% to 2.0% in December, indicating some easing inflation pressure but failing to support the euro. In comparison, strong U.S. data further boosted the dollar’s safe-haven appeal. For the average investor, this suggests sustained short-term strength in the dollar and potential continued downward pressure on EUR/USD. Market participants should closely watch upcoming U.S. nonfarm payroll and inflation data, as these will continue to drive market sentiment and currency movement.
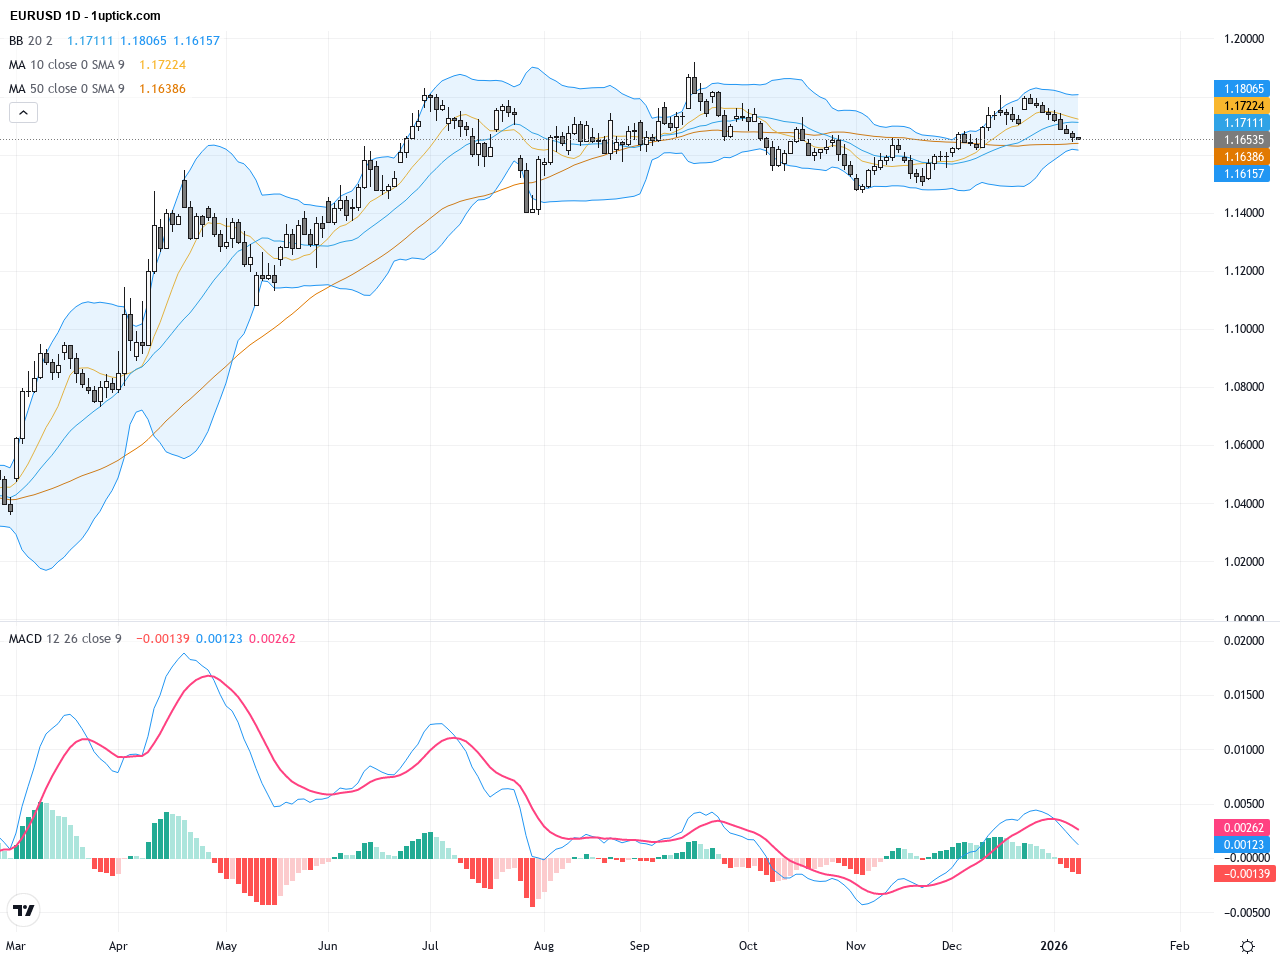
The EURUSD daily chart shows a sustained downtrend since the start of the year with repeated tests of support around 1.17 failing to generate a sustained rebound. The 20-day and 50-day moving averages have formed a bearish crossover confirming the downward momentum. Bollinger Bands have narrowed but remain below the midline, indicating price action favors the downside. The MACD histogram is expanding negatively, with signal lines declining, suggesting continuing bearish momentum.

The hourly chart for EURUSD over the last 5 days reveals a clear downward trend, with price persistently falling below the short-term 20-period moving average and failing to regain the Bollinger Bands middle band. The MACD recently formed a bearish crossover and RSI is approaching oversold conditions without a clear reversal signal yet. The latest engulfing candlestick pattern stresses increasing selling pressure, indicating limited short-term rebound potential and risk of further downside testing.
Technical Trend: The current trend is cautiously bearish, characterized by persistent selling pressure and low volatility contraction, with possible short-term rebounds near key support levels.
A dominant technical pattern on the EURUSD daily chart is a bearish continuation flag that started forming approximately six days ago, reinforcing the prevailing downtrend. The recent engulfing candlestick on the hourly chart confirms strong short-term selling pressure. MACD bearish crossover and RSI nearing oversold levels without bounce signals imply continued downside bias. Traders focusing on technical setups may view this as an opportunity to enter short positions. A confirmed break below 1.1600 could trigger a new leg lower.Today, there are no significant or direct economic events expected to impact EURUSD immediately. Key releases such as German, French, and European Union industrial production and retail sales data are scheduled, which could mildly influence the euro if results disappoint. However, major market-moving data will come later during the US session, including employment reports. Traders should pay close attention to these evening US releases for potential sharp movements in EURUSD.
Resistance & Support

The above financial market data, quotes, charts, statistics, exchange rates, news, research, analysis, buy or sell ratings, financial education, and other information are for reference only. Before making any trades based on this information, you should consult independent professional advice to verify pricing data or obtain more detailed market information. 1uptick.com should not be regarded as soliciting any subscriber or visitor to execute any trade. You are solely responsible for all of your own trading decisions.