


 |
| Gold V.1.3.1 signal Telegram Channel (English) |

GBPUSD: Breaking Key Support as Dollar Strength Pressures the Pound
2026-01-12 @ 13:02
Over the past 24 to 48 hours, GBP/USD has exhibited clear volatility, hovering around the 1.3400 mark with yesterday’s closing price at 1.34223, showing a slight decline overall. Market sentiment was chiefly influenced by US economic data, particularly the January Nonfarm Payrolls (NFP) report, which bolstered the US dollar and subdued the pound’s rebound momentum.
The recent strength in the dollar stems from diminishing market bets on a Federal Reserve rate hike pause, especially after the US December NFP data missed expectations, leading to a short-term dollar rally and pushing GBP/USD below the 1.3450 level, increasing downside pressure on the pound.
From a UK economic perspective, although the December composite and services PMI showed slight improvements, they failed to support a stronger pound, reflecting a tension between strong external dollar forces and mixed UK economic data, resulting in GBP/USD oscillating downward amid waning market confidence.
For the average investor, this scenario is like being caught between two opposing forces in the market—the US dollar gaining strength on resilient American economic data, while the pound struggles due to underwhelming UK economic performance. Investors should exercise caution, closely monitoring upcoming inflation data and Federal Reserve policy signals, as these will play a crucial role in determining GBP/USD’s next move.
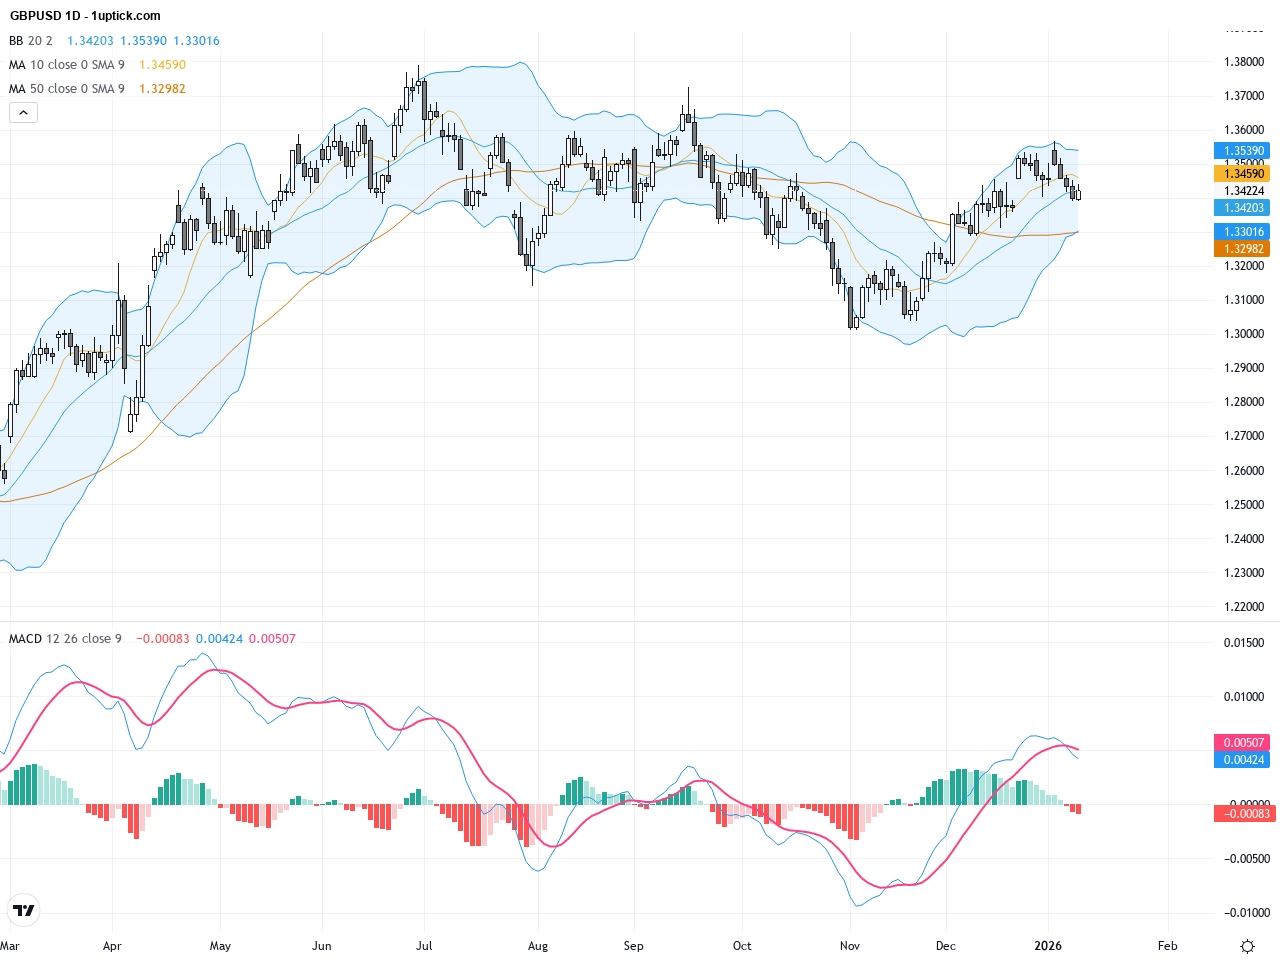
The GBPUSD daily chart shows a broad trading range since the end of 2025, but recent price action has broken below the 200-day moving average (around 1.34149), indicating a possible shift to a longer-term bearish trend. The daily MACD shows a bearish crossover, signaling increased selling pressure, and the Bollinger Bands are contracting with prices frequently testing the lower band, suggesting potential further downside. Overall, the daily timeframe favors bears, and traders should watch key support levels closely to judge future direction.

The hourly chart over the past 3-5 days depicts a clear downtrend, with prices repeatedly testing and falling below the key 1.3450 level. Short-term moving averages (50 and 100 periods) are sloping down and prices remain beneath them, confirming sellers dominate the near term. The MACD remains below zero, showing negative momentum. A recent bearish engulfing candlestick pattern suggests continuation of the downtrend over the next 24 hours, though watch for quick pullbacks.
Technical Trend: Clearly bearish trend
Technically, GBPUSD has breached multiple short-term support levels with the daily MACD forming a bearish crossover and price pushing lower along the lower Bollinger Band, confirming a bearish bias. The hourly bearish engulfing pattern reinforces the strong short-term selling pressure. Moving averages align bearishly in both short and medium term. Unless there is a strong reversal back above the 200-day moving average, the bearish trend is likely to persist. Risk management and monitoring for reversal signals remain critical.Today’s economic calendar features speeches from ECB officials and several FOMC members, which could induce some market volatility but no direct data is expected to have an immediate impact on GBPUSD. Additionally, Hungarian Industrial Production and the EU Sentix Index will be reported, although their immediate relevance to GBPUSD is limited. Traders should focus on upcoming US Fed speeches this evening, as they may briefly influence the US dollar and consequently GBPUSD.
Resistance & Support

The above financial market data, quotes, charts, statistics, exchange rates, news, research, analysis, buy or sell ratings, financial education, and other information are for reference only. Before making any trades based on this information, you should consult independent professional advice to verify pricing data or obtain more detailed market information. 1uptick.com should not be regarded as soliciting any subscriber or visitor to execute any trade. You are solely responsible for all of your own trading decisions.