


 |
| Gold V.1.3.1 signal Telegram Channel (English) |

GBPUSD Faces Resistance Near 1.3750 Amid USD Strength: Key Technical & Fundamental Analysis
2026-01-30 @ 13:01
Over the past 24 to 48 hours, the GBP/USD currency pair experienced notable volatility, sliding from yesterday’s closing price of 1.38092 down to around 1.3750. The movement was largely influenced by the US Senate advancing a spending deal to avoid a government shutdown, which bolstered the US dollar. Additionally, the Federal Reserve’s decision to hold rates steady and signal a steady monetary policy stance provided further support to the dollar, weighing on GBP/USD.
For the average investor, this fluctuation highlights how the dollar strengthens amid political and policy developments, temporarily halting the pound’s upward momentum. When facing US political and economic uncertainties, investors often flock to the dollar as a safe haven, putting pressure on GBP/USD. This dynamic reflects the prevailing market sentiment over the recent period.
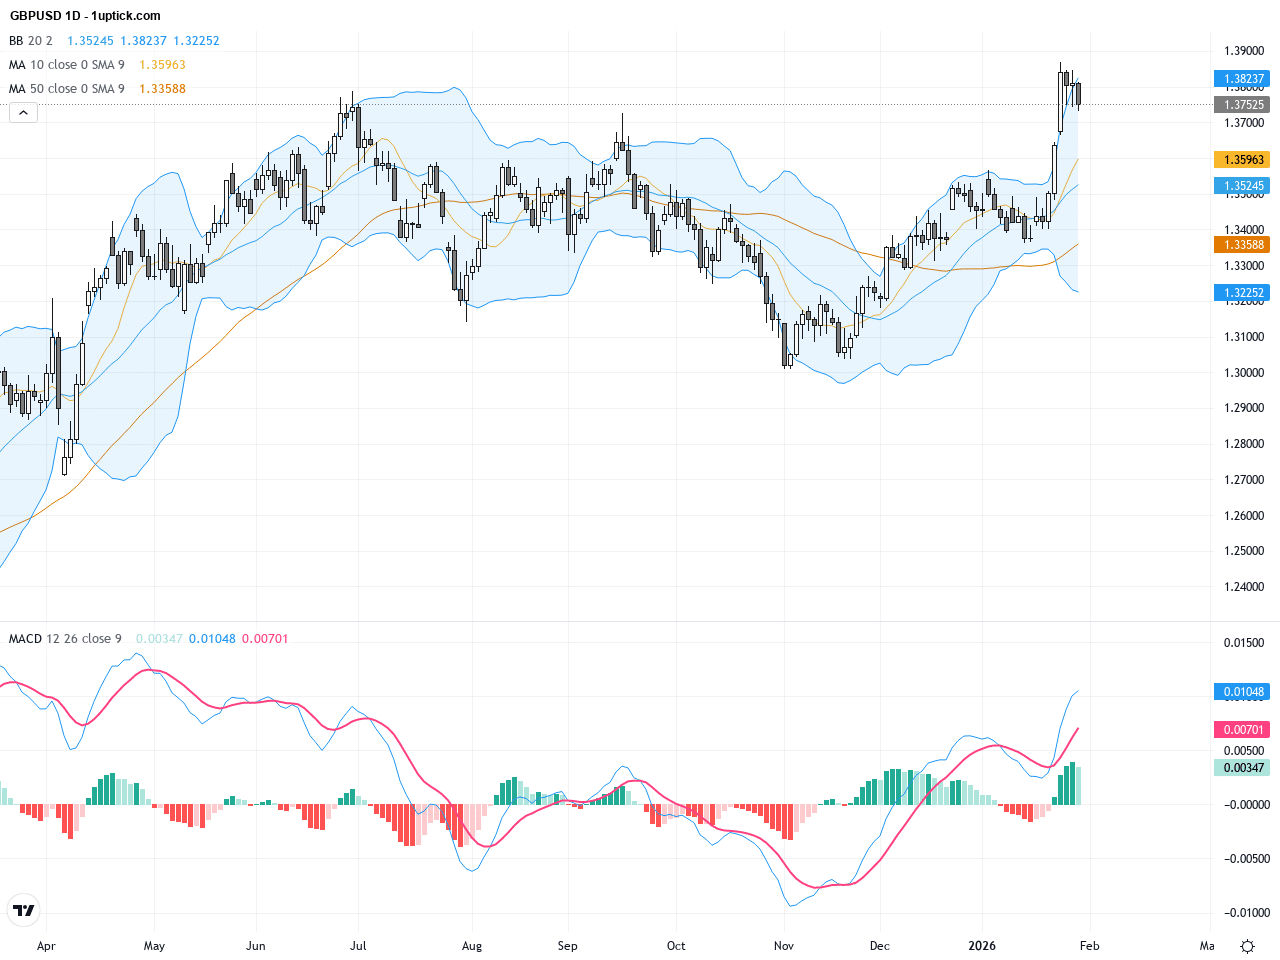
The daily chart illustrates an overall uptrend in GBPUSD since early 2026, with recent price action encountering resistance around the 1.38 area. Current levels remain above both the 50-day moving average (~1.34475) and 200-day moving average (~1.34144), maintaining a bullish bias. However, tightening Bollinger Bands and a shrinking MACD histogram suggest weakening momentum, potentially signalling a period of consolidation. The longer-term trend remains bullish but warrants attention to volume and momentum divergence.
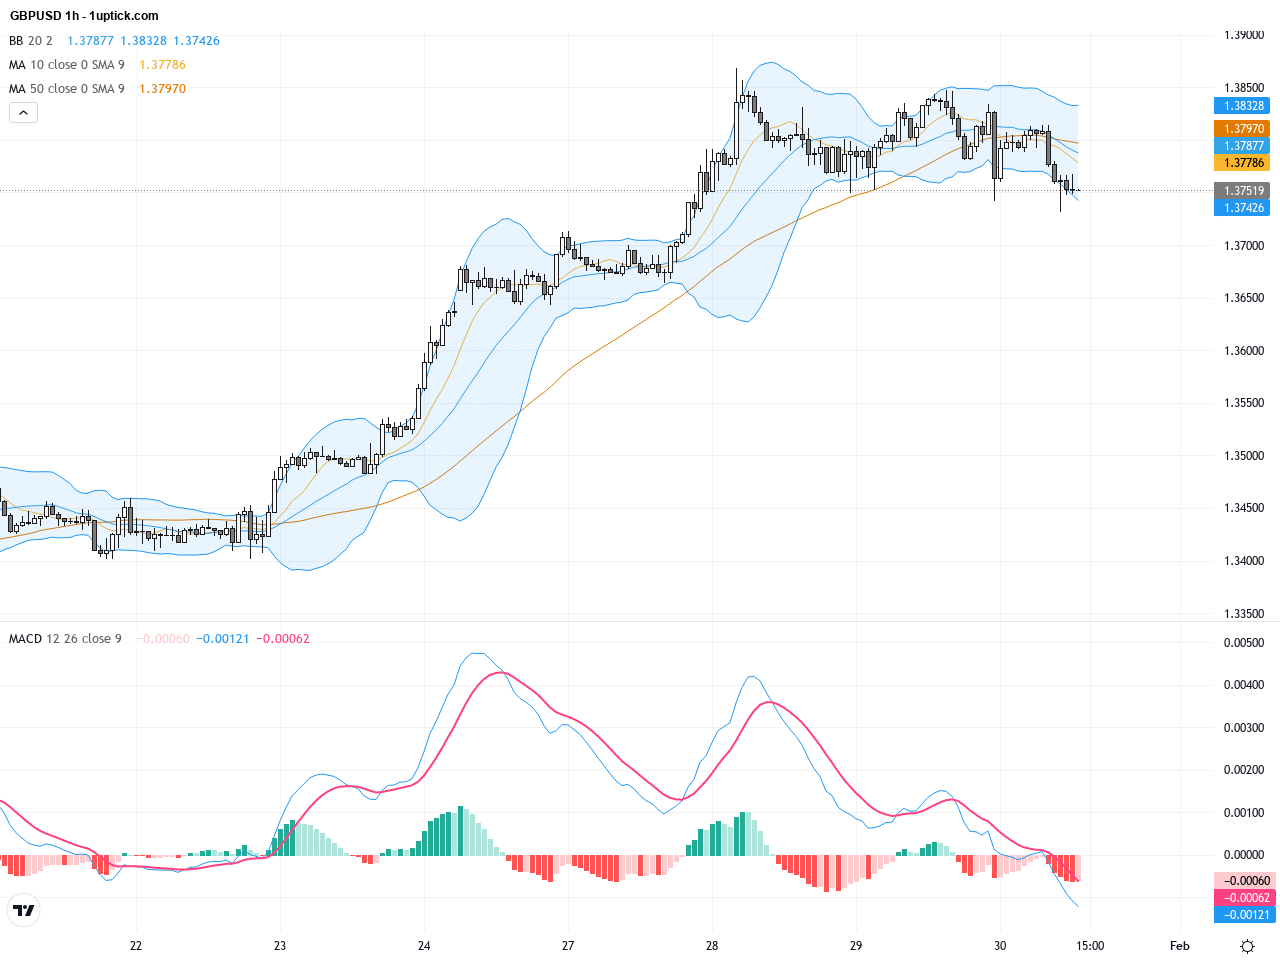
The hourly chart over the last 3-5 days reveals GBPUSD consolidating around 1.3750, with short-term moving averages crossing bearish and MACD forming a bearish crossover, indicating intensified selling pressure. The middle Bollinger Band is acting as resistance, and failure to break above may test support near 1.3730 or lower. Recent candlesticks with long upper and lower shadows (doji-like) demonstrate significant indecision and volatility in the short term.
Technical Trend: GBPUSD is presently showing a cautiously bearish trend, characterized by short-term pressure and a consolidation phase, signaling a cautious outlook.
Technical indicators point to weakening bullish momentum in GBPUSD, with the daily MACD histogram shrinking, signaling momentum loss and a potential short-term pullback. The hourly MACD bearish crossover and moving average alignment confirm increased short-term selling. The current sideways consolidation zone emphasizes market indecision as it awaits a breakout signal. Holding above the 1.3730 support could spark a rebound, while a break below may accelerate declines. Volume remains steady, suggesting a new directional move is brewing—traders should watch critical technical triggers closely.Today’s economic calendar in GMT+1 highlights several European data releases and UK mortgage approvals plus M4 money supply at 10:30. The UK data is unlikely to cause significant GBPUSD volatility. The US releases multiple Producer Price Index (PPI) and core PPI figures at 14:30, which are more directly relevant to USD strength and thus GBPUSD. Stronger-than-expected US PPI would likely reinforce USD strength, putting additional pressure on GBPUSD, whereas weaker data could relieve some downside pressure. Other global data from Japan and Australia have limited direct impact on GBPUSD today.
Resistance & Support

The above financial market data, quotes, charts, statistics, exchange rates, news, research, analysis, buy or sell ratings, financial education, and other information are for reference only. Before making any trades based on this information, you should consult independent professional advice to verify pricing data or obtain more detailed market information. 1uptick.com should not be regarded as soliciting any subscriber or visitor to execute any trade. You are solely responsible for all of your own trading decisions.