


 |
| Gold V.1.3.1 signal Telegram Channel (English) |

GBPUSD: Head & Shoulders Pattern Signals Potential Downside, Watch Critical Support Levels
2026-01-16 @ 13:01
Over the past 24 to 48 hours, GBP/USD continued to hover near 1.3380, with yesterday’s closing price at 1.33889. The US dollar maintained strength driven by cautious comments from Federal Reserve officials and strong recent employment data, putting clear pressure on the British pound.
According to the latest market news, hawkish signals from multiple FOMC members and Fed speakers have fueled expectations for further rate hikes, bolstering the US dollar. Meanwhile, despite the UK’s upbeat GDP data, the pound failed to gain traction as market participants remain cautious about potential Bank of England policy easing. This conflicting environment has placed additional pressure on GBP/USD, keeping it stuck below key psychological levels.
In a nutshell, for everyday investors, a strong US economy and tightening Fed policy typically lift the US dollar; although the UK shows some growth, uncertainties over its central bank’s stance weigh on the pound. This dynamic has kept GBP/USD in a weak, range-bound pattern recently, emphasizing the importance of monitoring US dollar trends and global economic data as key drivers of currency movements.
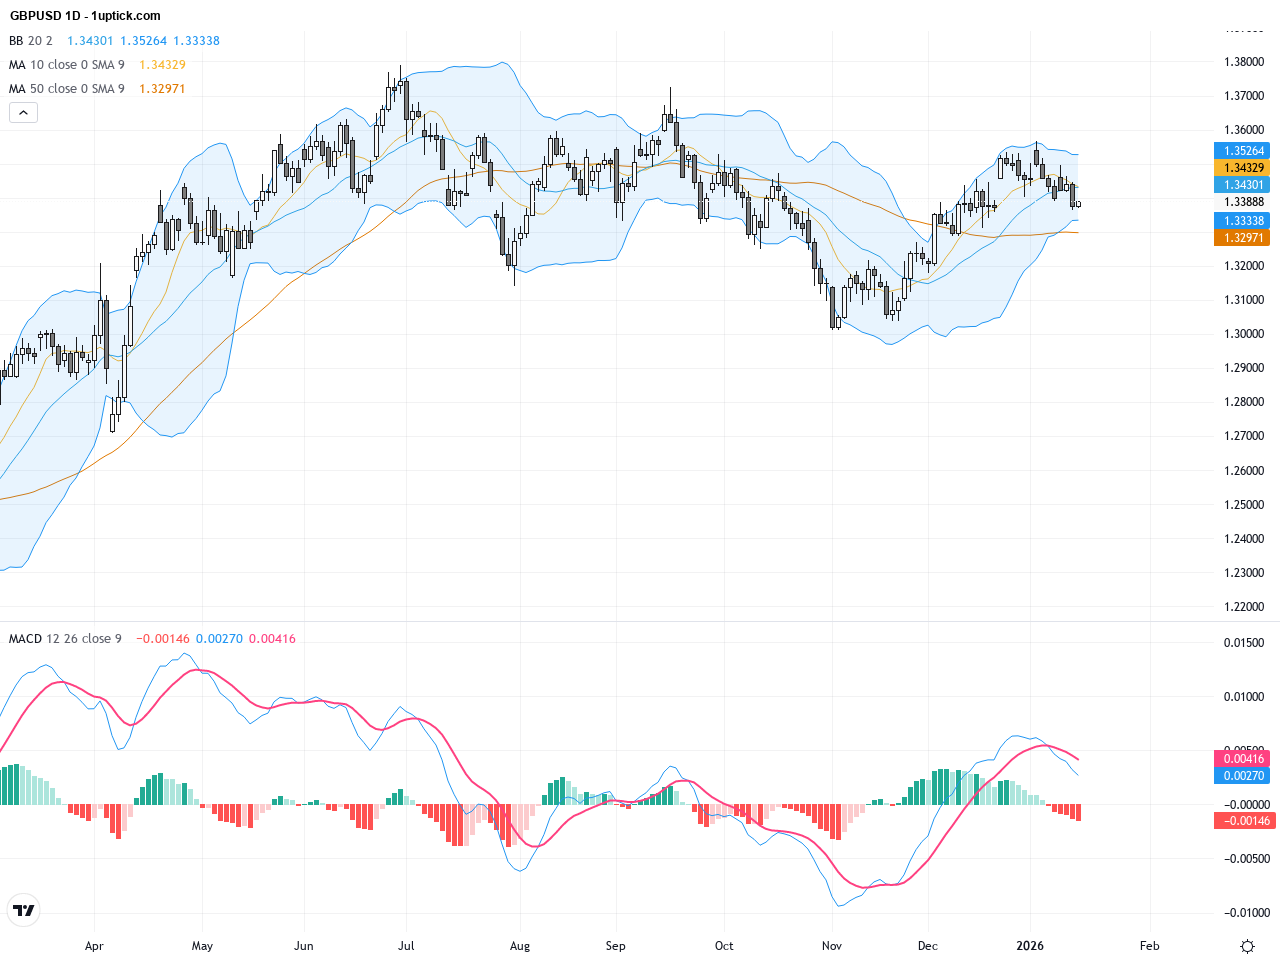
The daily chart reveals a clear downtrend for GBPUSD since the start of the year. Prices have steadily declined from the high near 1.3788 and are trading below the 200-day moving average close to 1.3414, indicating sustained bearish momentum. The Bollinger Bands are narrowing, suggesting reduced volatility, while multiple attempts to break above the 200-day moving average have failed. The MACD remains below the zero line, confirming continued downward pressure and a cautious outlook for Sterling’s recovery.
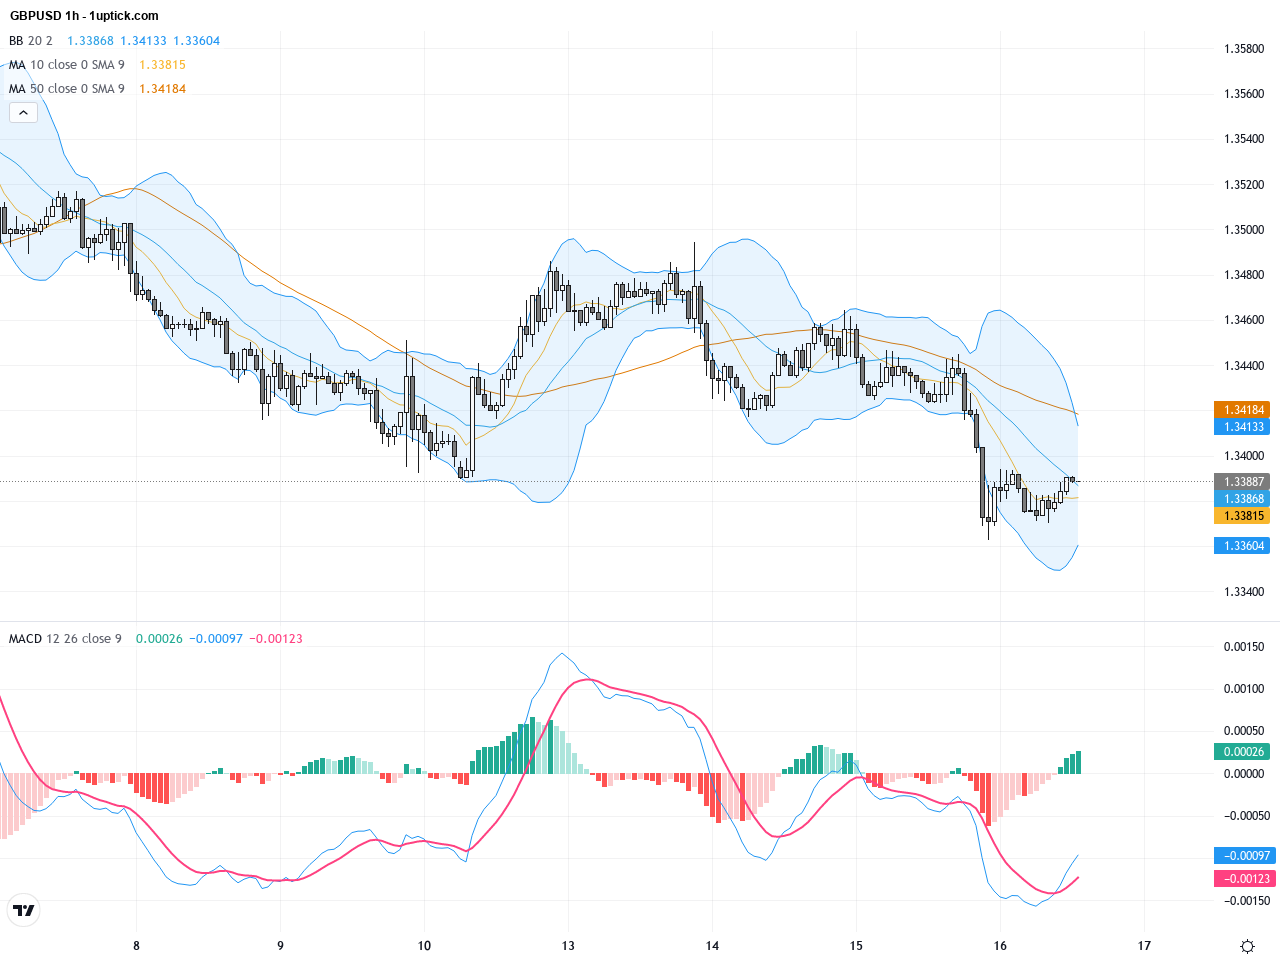
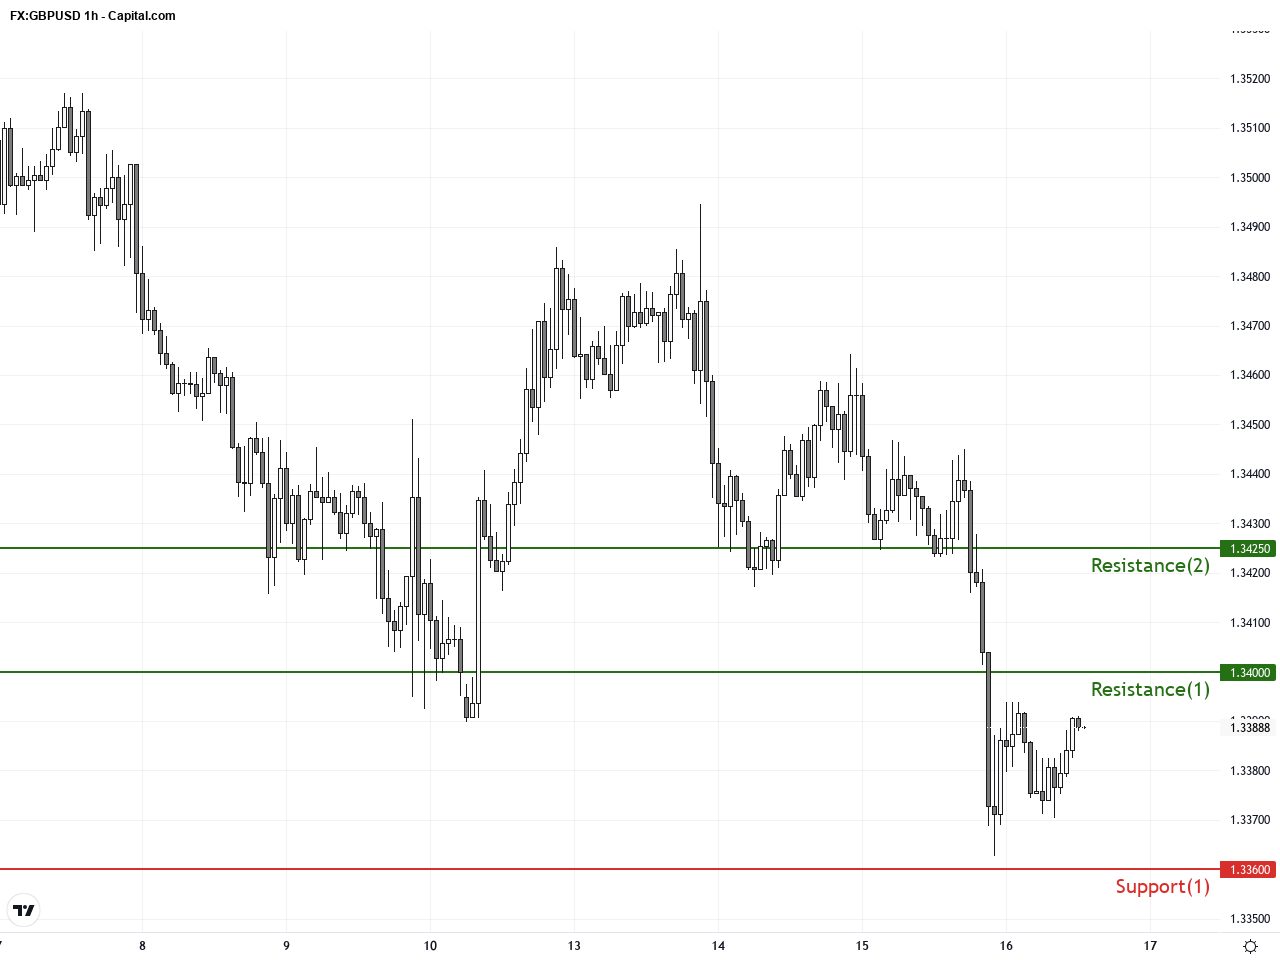
On the hourly chart, GBPUSD has been consolidating in a range between approximately 1.3350 and 1.34 over the past 3-5 days. Moving averages (5 and 20 periods) are intertwined, reflecting short-term indecision. Recently, a potential head and shoulders pattern has been forming with the neckline around 1.3360. A breakdown below this level could trigger accelerated downside momentum. The MACD shows bearish crossover signals and Bollinger Bands are contracting, signaling that a breakout is imminent.
Technical Trend: Trend Direction: GBPUSD is currently in a consolidating-to-bearish phase with a short-term downtrend evident on the hourly chart and a sustained medium-term bearish bias on the daily chart, suggesting cautious short-selling setups.
Key technical insights highlight the development of a head and shoulders reversal pattern for GBPUSD, a classic bearish signal. The neckline at approximately 1.3360 acts as crucial support; a break below may accelerate the downside push. Daily MACD indicates persistent bearish momentum, while the short-term hourly MACD bearish crossover confirms a weakening momentum. Resistance zones near 1.34 act as barriers to relief rallies. Traders should use these levels for stop-loss placement and cautious trade management.Today’s economic calendar in GMT+1 includes key German and Italian Consumer Price Index releases, and a speech by the Bank of England Governor Bailey. However, these events are expected to have neutral to low direct impact on GBPUSD. Later US data including Industrial Production and Capacity Utilization figures could influence the US Dollar’s strength; better-than-expected numbers may further pressure GBPUSD. Overall, no immediate significant economic events are scheduled to decisively move GBPUSD today.
Resistance & Support
The above financial market data, quotes, charts, statistics, exchange rates, news, research, analysis, buy or sell ratings, financial education, and other information are for reference only. Before making any trades based on this information, you should consult independent professional advice to verify pricing data or obtain more detailed market information. 1uptick.com should not be regarded as soliciting any subscriber or visitor to execute any trade. You are solely responsible for all of your own trading decisions.