


 |
| Gold V.1.3.1 signal Telegram Channel (English) |

GBPUSD: Trading Below 1.3450 as US Retail Sales and PPI Loom — Key Technical Patterns in Focus
2026-01-14 @ 13:02
Over the past 48 hours, the GBP/USD exchange rate experienced notable volatility, dipping from yesterday’s closing price of around 1.3440 down to approximately 1.3425. This movement was largely driven by market anticipation ahead of the US retail sales and PPI releases. The British Pound came under pressure as the US dollar strengthened following inflation data that met expectations. Earlier, the GBP had a brief rally due to news of the US Department of Justice investigating Fed Chair Jerome Powell, but the dollar quickly regained momentum, preventing the Pound from sustaining its gains.
Market focus remains on US economic data, with inflation steady at 2.7%, reinforcing the dollar’s strength. The GBP/USD appears to be trading in a range as traders await further economic indicators to guide future moves. For average investors, this price action underscores the high sensitivity of forex markets to US economic data releases — even slight deviations from forecasts can trigger short-term price shifts, highlighting the importance of prudent risk management.
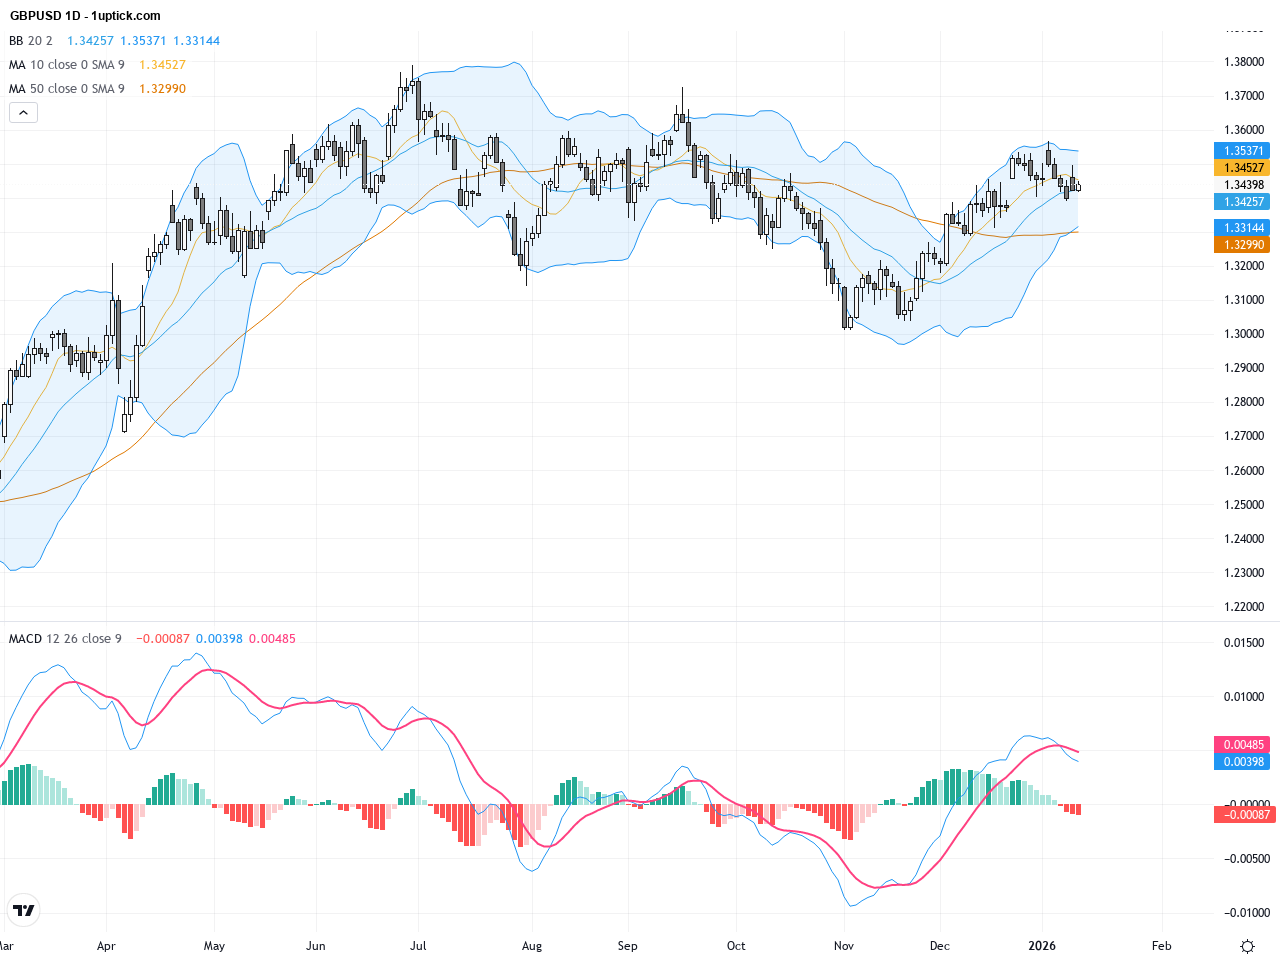
The daily chart shows GBPUSD moving sideways between 1.3350 and 1.3550 after a recent mild pullback from a higher level. The 50-day moving average is near 1.3343, while the 200-day average stands around 1.3415, with price hovering slightly above the latter, indicating consolidation. Bollinger Bands are narrowing, signaling reduced volatility. The MACD fluctuates near zero, showing lack of a definitive trend. Traders should watch for breakout signals and confirmation of directional momentum in the coming sessions.

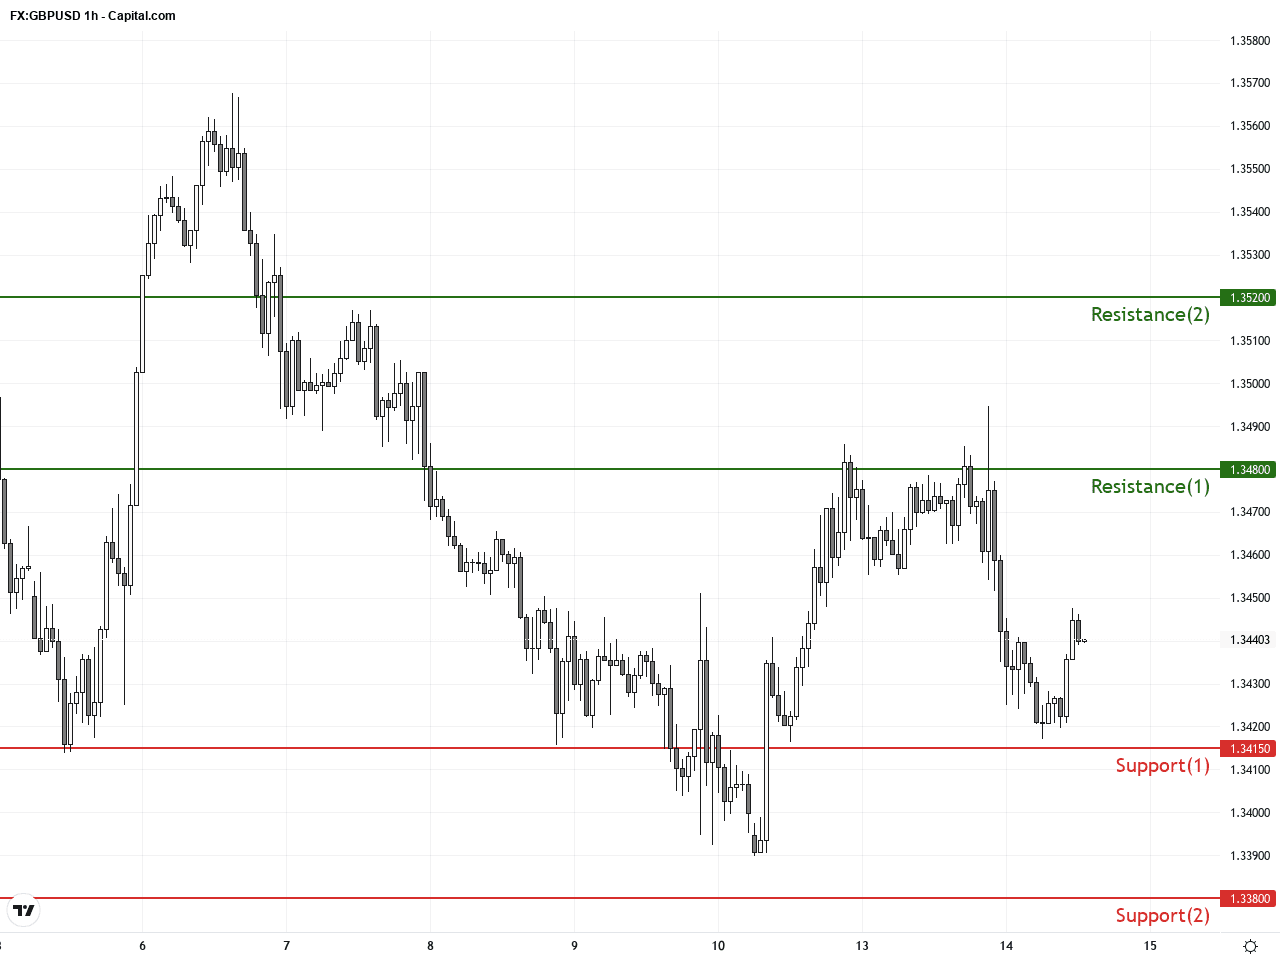
On the hourly chart, GBPUSD has traded in a narrow band between 1.3420 and 1.3460 over the past 3-5 days. The 20-period moving average acts as immediate resistance, while the lower Bollinger Band provides support. The MACD recently crossed bullishly, suggesting short-term upward momentum, but awaits confirmation from fundamental catalysts. The RSI rests near neutral but points to potential room for upside, with resistance around 1.3480 likely to be tested soon.
Technical Trend: Currently, GBPUSD is in a ‘Cautiously Consolidating’ phase, fluctuating between 1.34 and 1.35 as the market awaits fresh economic data to set a clearer directional bias.
Technically, GBPUSD is consolidating within a tight range without breaking key support or resistance levels. The contraction in Bollinger Bands on the daily chart paired with a neutral MACD suggests market indecision. On the hourly timeframe, a MACD bullish crossover and moderate RSI support a potential short-term rebound, though the pair faces resistance near 1.3480-1.3500. Recent candlestick patterns include a doji formation, underscoring short-term equilibrium between buyers and sellers. The upcoming US data releases will likely serve as the catalyst for an imminent breakout or breakdown, thereby providing a high-probability trading opportunity.Today’s GMT+1 economic calendar lacks major UK data releases; however, the focal point is the US economic prints at 14:30 GMT+1 — the Retail Sales and Producer Price Index for November. These US indicators directly affect the USD and thus the GBPUSD price. Should US Retail Sales or PPI beat forecasts, the USD will likely gain strength, pressuring GBPUSD lower. Conversely, disappointing US data could provide relief rallies for GBPUSD. Traders should be prepared for increased volatility around this time and plan entries accordingly.
Resistance & Support
The above financial market data, quotes, charts, statistics, exchange rates, news, research, analysis, buy or sell ratings, financial education, and other information are for reference only. Before making any trades based on this information, you should consult independent professional advice to verify pricing data or obtain more detailed market information. 1uptick.com should not be regarded as soliciting any subscriber or visitor to execute any trade. You are solely responsible for all of your own trading decisions.