Month: January 2026

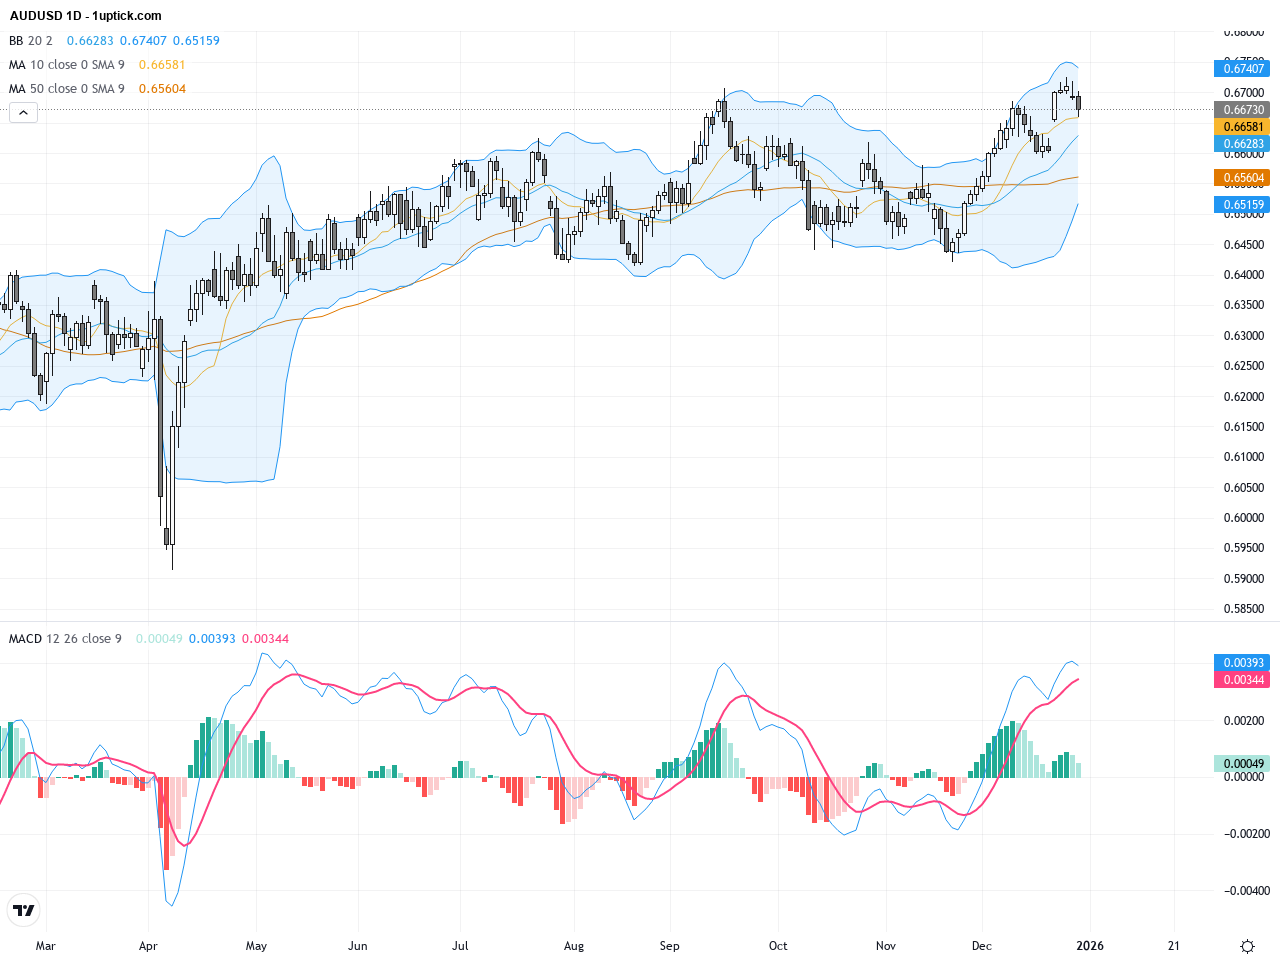
AUDUSD Technical and Fundamental Outlook: Key Support and Resistance Levels Explained

Over the past three trading days, AUDUSD has hovered around the 0.67 handle, experiencing muted volatility due to holiday season low volumes. A stronger-than-expected US labor market boosted the dollar, applying downward pressure on the Australian dollar, which closed yesterday at 0.66767, slightly lower than the prior day. The divergent monetary policy views between the RBA and the Fed continue to shape the pair’s outlook. Recent market news highlights that AUDUSD is testing critical technical levels and may be poised for significant movement. For the average investor, the current scenario is like standing at a crossroads, where careful consideration of technical signals and market news is essential before making a trade decision.
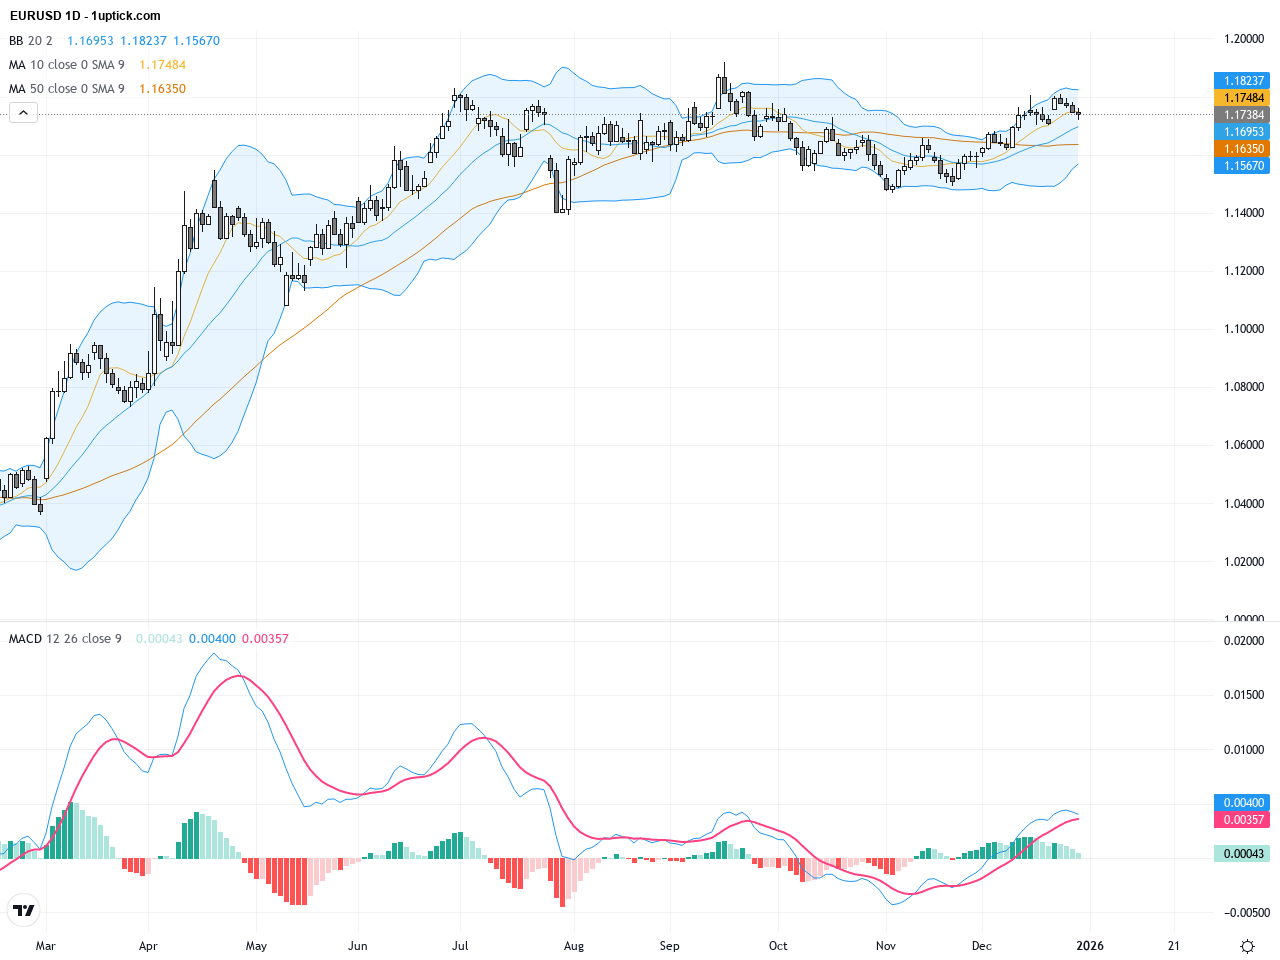
EURUSD Technical & Fundamental Analysis: Can Bulls Overcome Multiple Resistance Levels?

Over the past three trading days, EURUSD has traded in a narrow range around 1.17512, reflecting cautious market sentiment. Driven by a strong multi-year EUR rally of over 17%, the pair is now testing critical resistance near multi-year highs amid diverging monetary policies between the ECB and Fed. Latest market news highlights investor focus on central bank actions as the key driver behind recent price moves. For an average investor, this means EURUSD price volatility is tightly linked to macroeconomic and policy developments, requiring careful trading around key technical levels. Overall, EURUSD remains in a consolidating bullish environment awaiting a decisive breakout.

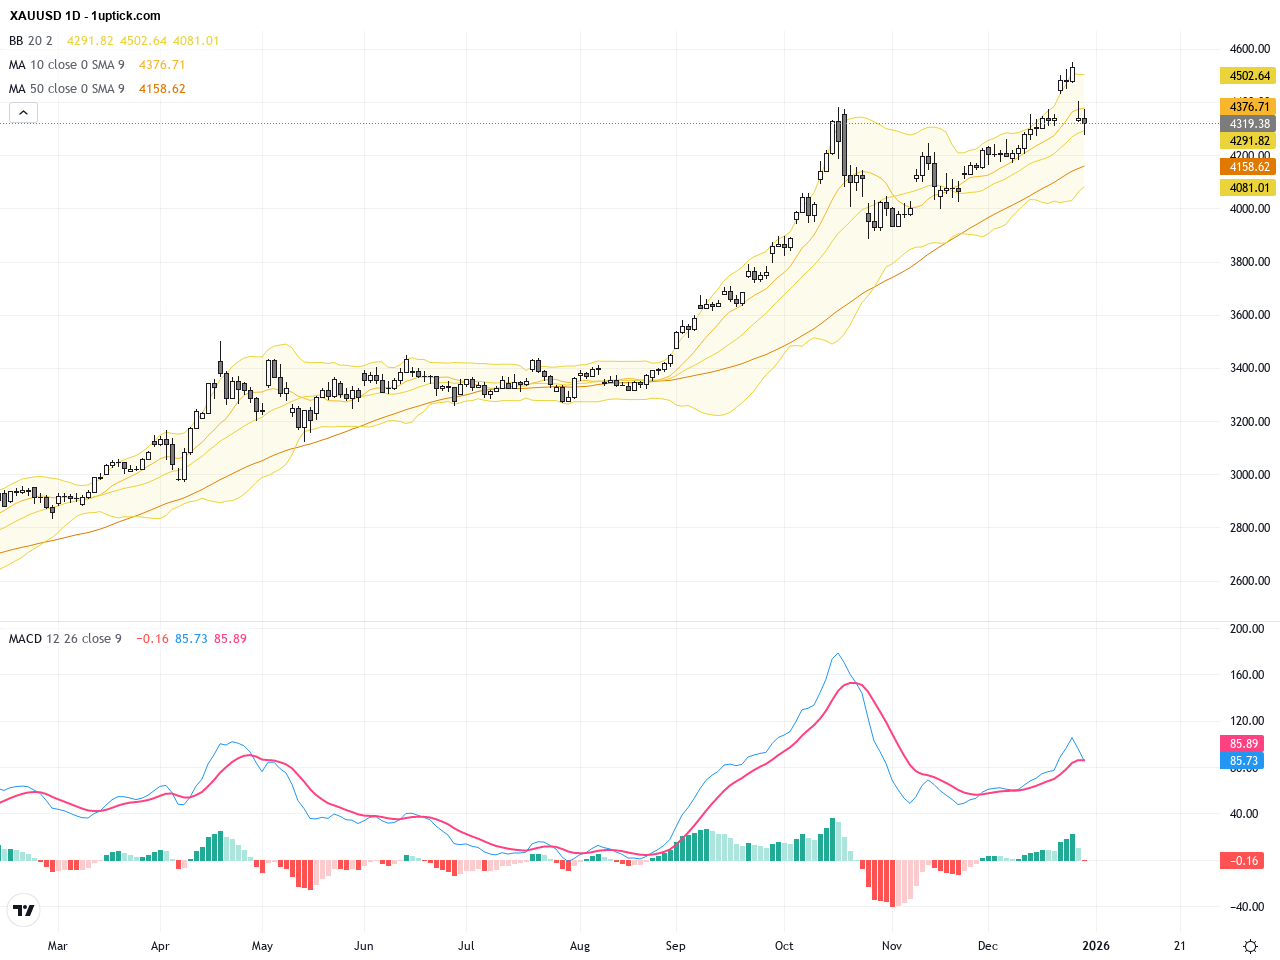
XAUUSD: Gold Price Holds Above 4300 Amid Cautious Pullback – Key Technical Patterns & Trading Outlook

Over the past three trading days, XAUUSD has seen a notable pullback from its late December highs around 4550 to close near 4315 on December 31. The gold market remains buoyed by surging ETF demand and strong US GDP data, yet recent price action signals profit-taking pressure. For everyday investors, this means gold remains a prime safe-haven asset, though short-term volatility is likely. This report covers the fundamental backdrop, explores key technical support and resistance levels, and offers actionable insights relevant for traders aiming to navigate the current gold price analysis effectively.

Economic Indicators of 2025 and What to Watch in 2026

2025 was a rollercoaster for the U.S. economy — tariffs upended global trade, consumer confidence dipped near historic lows, and the stock market soared to new heights. Discover which economic indicators truly shaped the past year and what to watch for in 2026.

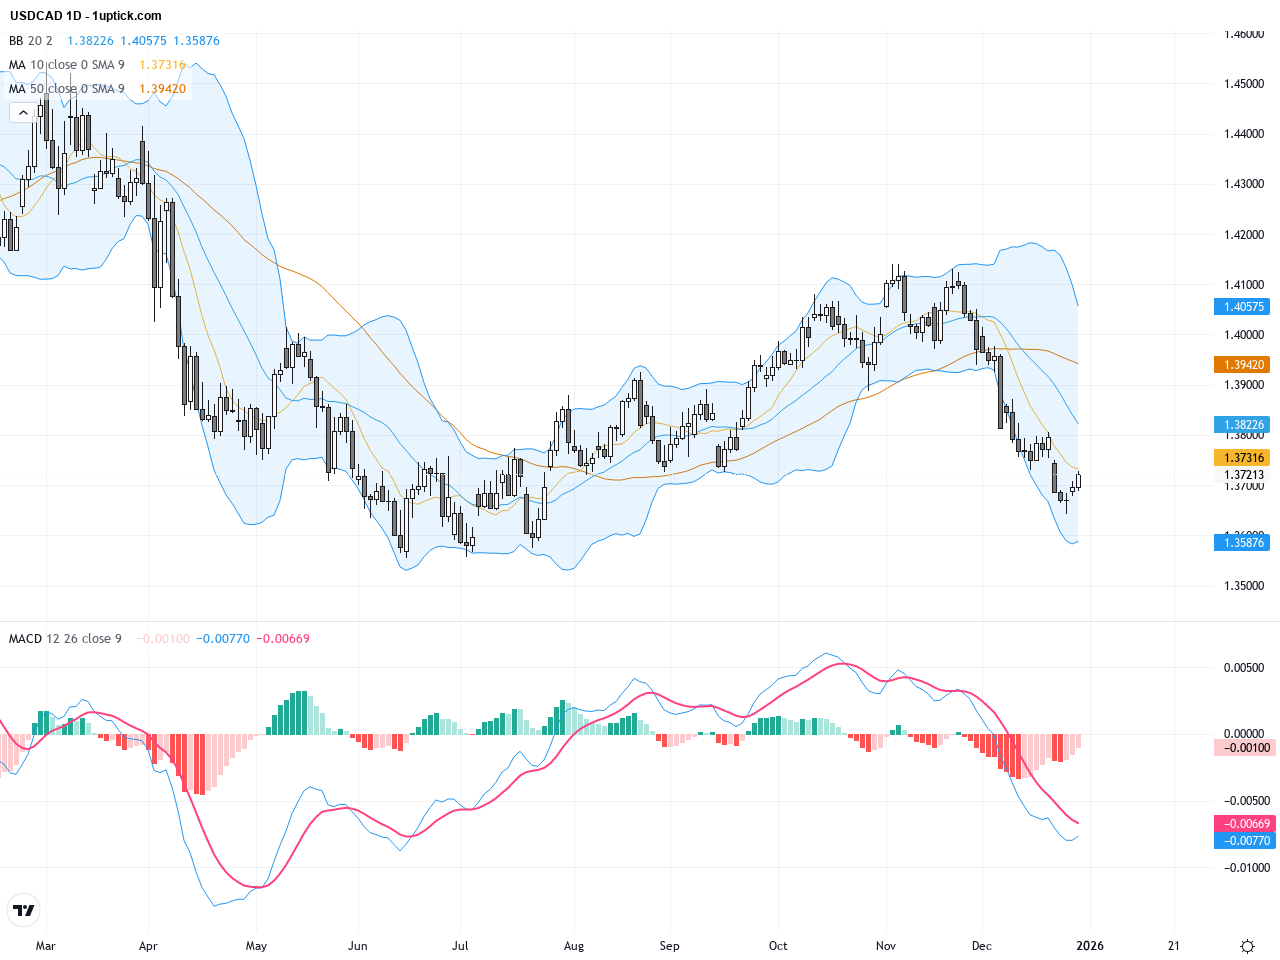
USDCAD Technical Analysis: Key Support and Resistance Levels with Trading Outlook

Over the past three trading days, USDCAD has shown notable volatility, closing yesterday at 1.3721, indicating some bullish momentum remains. The US dollar strengthened following robust labor market data, pushing the pair higher. However, rising oil prices have provided support for the Canadian dollar, leading analysts to take a cautious stance amid fundamental factors. Recent market news highlights potential pitfalls and key support challenges for USDCAD, with sentiment slightly bullish but vulnerable to pullbacks. For the average investor, this means closely monitoring US economic releases and oil price movements to capitalize on trading opportunities and manage risks effectively.

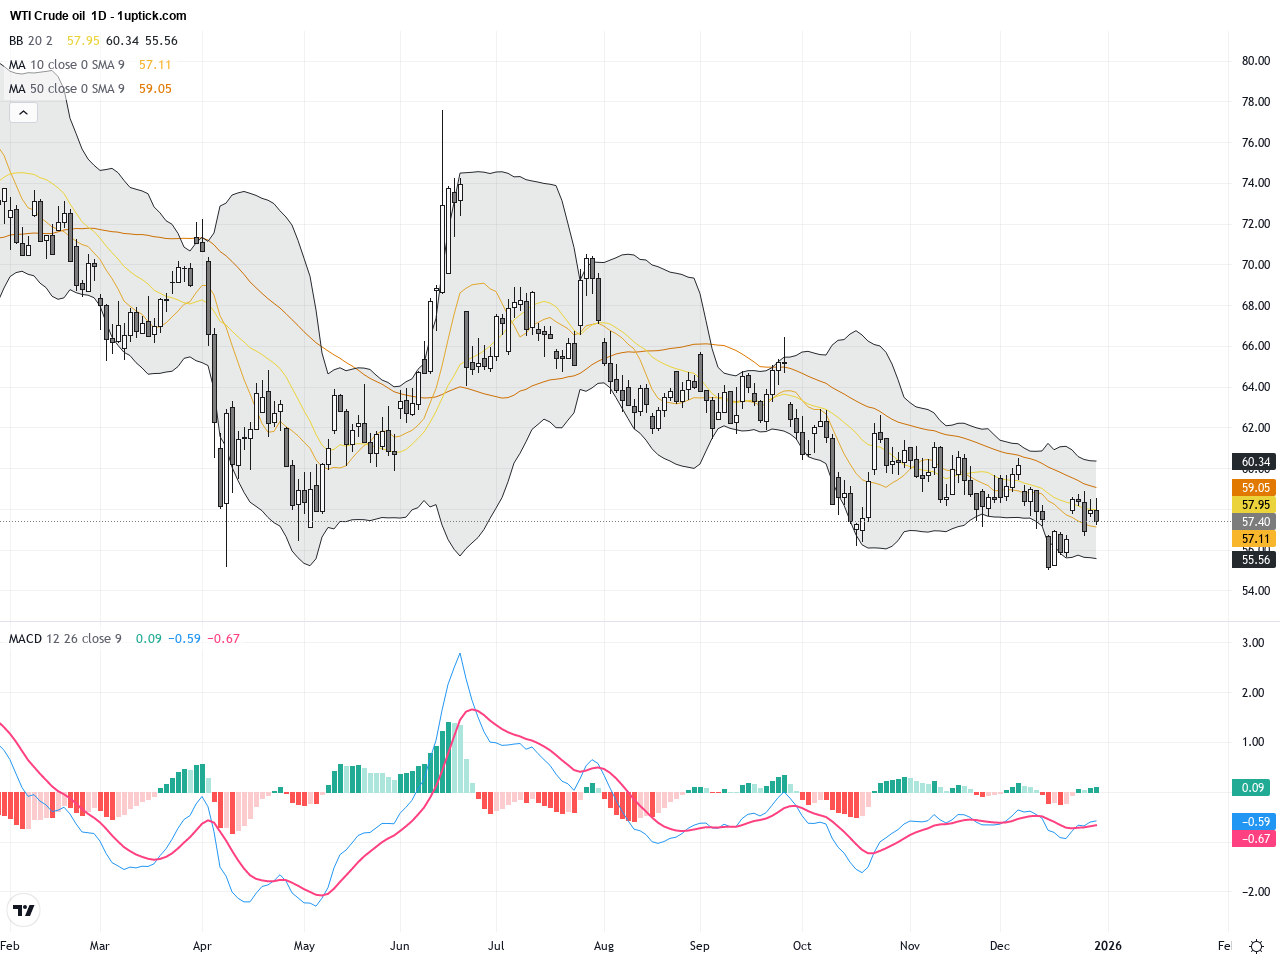
WTI Crude Oil: Key Support Pressures Trading Outlook and Technical Pattern Analysis

Over the past three trading days, WTI Crude Oil has hovered around $57.42, reflecting cautious market responses to abundant supply and a strong US dollar. Rising US oil inventories have pressured prices, forming a sideways-to-downtrend pattern. Recent reports show oil prices suffered their largest annual drop since 2020 in 2025, dimming market sentiment. For investors, understanding these supply dynamics and market moods is essential as WTI crude consolidates. Traders should closely monitor critical support and resistance levels to navigate this choppy backdrop effectively.

1uptick Analytics @

Risk Warning​

*Investment involves risk. You may use the information, strategies and trading signals on this website for academic and reference purposes at your own discretion. 1uptick cannot and does not guarantee that any current or future buy or sell comments and messages posted on this website/app will be profitable. Past performance is not necessarily indicative of future performance. It is impossible for 1uptick to make such guarantees and users should not make such assumptions. Readers should seek independent professional advice before executing a transaction. 1uptick will not solicit any subscribers or visitors to execute any transactions, and you are responsible for all executed transactions.

© 2022-26 1uptick Analytics all rights reserved.


Risk Warning​

*Investment involves risk. You may use the information, strategies and trading signals on this website for academic and reference purposes at your own discretion. 1uptick cannot and does not guarantee that any current or future buy or sell comments and messages posted on this website/app will be profitable. Past performance is not necessarily indicative of future performance. It is impossible for 1uptick to make such guarantees and users should not make such assumptions. Readers should seek independent professional advice before executing a transaction. 1uptick will not solicit any subscribers or visitors to execute any transactions, and you are responsible for all executed transactions.

© 1uptick Analytics all rights reserved.

Home
.AI
Analysis
Calendar
Tools