


 |
| Gold V.1.3.1 signal Telegram Channel (English) |

USDCAD: Critical Support Test Amid Mixed Signals in Trading Outlook
2026-01-06 @ 20:02
Over the past 24 to 48 hours, the USD/CAD pair has held steady around the 1.3750 level, with yesterday’s closing price at 1.37644. Price movement showed mild volatility during this period as the US Dollar slightly weakened, while pressure from oil prices weighed on the Canadian Dollar, keeping the USD/CAD relatively stable.
The market reacted to weaker-than-expected US ISM Manufacturing PMI data, causing the US Dollar Index to retreat from session highs. This limited the USD/CAD’s ability to build on recent gains, with resistance near 1.3800 proving difficult to surpass. Canada’s manufacturing sector showed contraction, adding to the Canadian Dollar’s struggles and fostering a brief rebound in USD/CAD; however, the overall US Dollar still faces dual challenges from mixed economic data and energy market pressures.
For the average investor, the USD/CAD’s recent action reflects a market pausing amid competing forces. The softer US Dollar reduces appeal for USD buying, yet the Canadian Dollar cannot strengthen meaningfully due to oil price headwinds. Overall, the market is waiting for clearer economic signals, particularly upcoming Canadian data and oil price trends, to help guide future rate direction.

The USDCAD daily chart reveals a recovery trend following the low around 1.3640 at year-end 2025, with prices trying to break above the 1.3800 resistance zone but facing challenges. The 50-day and 200-day moving averages at 1.38843 and 1.38279 respectively remain above current prices, indicating the pair is still within a medium-term bearish structure. The Bollinger Bands are tightening, and the MACD shows alternating momentum signals, suggesting a need for a confirmed breakout to determine the next trend direction.
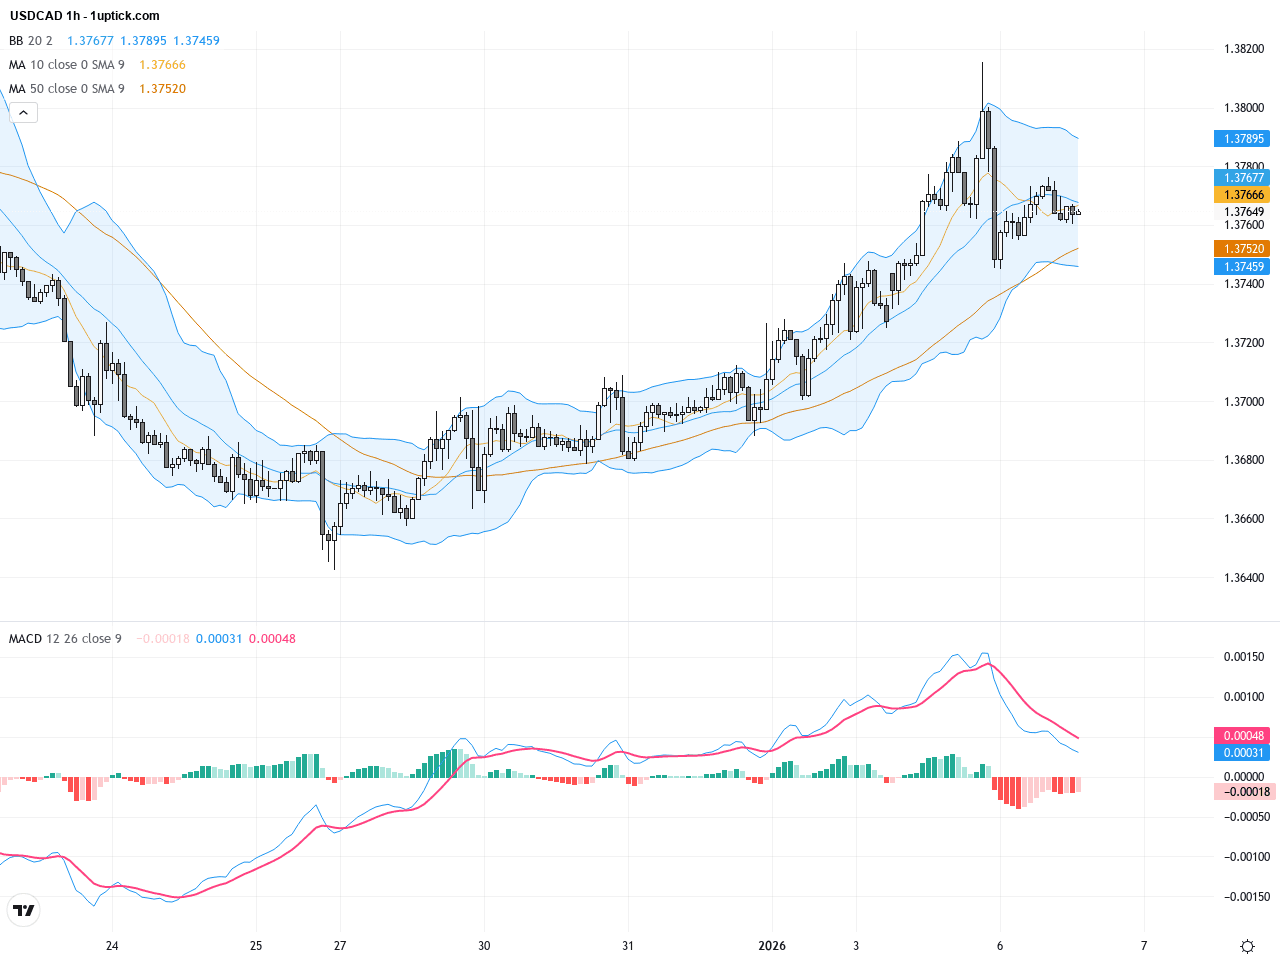
The hourly chart of USDCAD over the past 3-5 days shows a sideways movement with price oscillating around the middle Bollinger Band. Short-term moving averages are crossing frequently, and the MACD fluctuates near the zero line without clear trend dominance. Recent hammer and doji candlesticks indicate market indecision, suggesting the pair may find short-term support near 1.3730. Traders should exercise caution with short-term positions until a clearer trend emerges.
Technical Trend: Cautiously Sideways, Awaiting Clear Breakout
Technically, USDCAD is currently range-bound, forming a triangle consolidation pattern on the daily timeframe suggesting a possible upcoming breakout. Recent hammer and doji candlesticks reflect balanced buyer and seller forces. Close attention should be paid to the 1.3730 support level; a break below could trigger a new move downward, while a bounce might test resistance near 1.3800.There are no significant or directly relevant economic events for USDCAD on today’s calendar. Multiple European services PMI releases may impact the Euro but have limited direct effect on USDCAD. The US FOMC member Barkin’s speech could influence the US dollar and thus indirectly impact the pair. Additionally, the weekly US API crude oil inventory report later today is worth watching, as oil price changes tend to affect the Canadian dollar and may thus influence USDCAD volatility.
Resistance & Support

The above financial market data, quotes, charts, statistics, exchange rates, news, research, analysis, buy or sell ratings, financial education, and other information are for reference only. Before making any trades based on this information, you should consult independent professional advice to verify pricing data or obtain more detailed market information. 1uptick.com should not be regarded as soliciting any subscriber or visitor to execute any trade. You are solely responsible for all of your own trading decisions.