


 |
| Gold V.1.3.1 signal Telegram Channel (English) |

USDCAD: Key Resistance at 1.3900 Holds as Market Awaits US CPI Data
2026-01-14 @ 05:25
Over the past 24 to 48 hours, the USD/CAD pair has traded in a narrow range between 1.385 and 1.390, showing limited volatility but highlighting investors’ keen focus on upcoming US Consumer Price Index (CPI) data. The pair closed yesterday at 1.38816, with a slight uptick as expectations of US inflation supported the US dollar.
According to the latest market news, the Canadian dollar has remained relatively firm, bolstered by rising oil prices which have strengthened the demand for the loonie. Meanwhile, the US dollar experienced some weakness amid concerns over Federal Reserve independence. The brief USD/CAD rally reflects cautious investor positioning ahead of crucial US nonfarm payroll figures later this week. Bank of America recently shifted its USD/CAD outlook to neutral, viewing the Canadian economy as stable without signs of overheating, suggesting the pair is expected to oscillate within the 1.37 to 1.39 range.
For the average investor, the recent market action resembles a waiting game ahead of important economic data releases—the pair moves modestly, but the main players remain on the sidelines, awaiting fresh catalysts. The recovery in oil prices provides some support for the Canadian dollar, yet underlying US dollar fundamentals continue to hold sway. Following the inflation data release, USD/CAD is poised for a potential directional move.
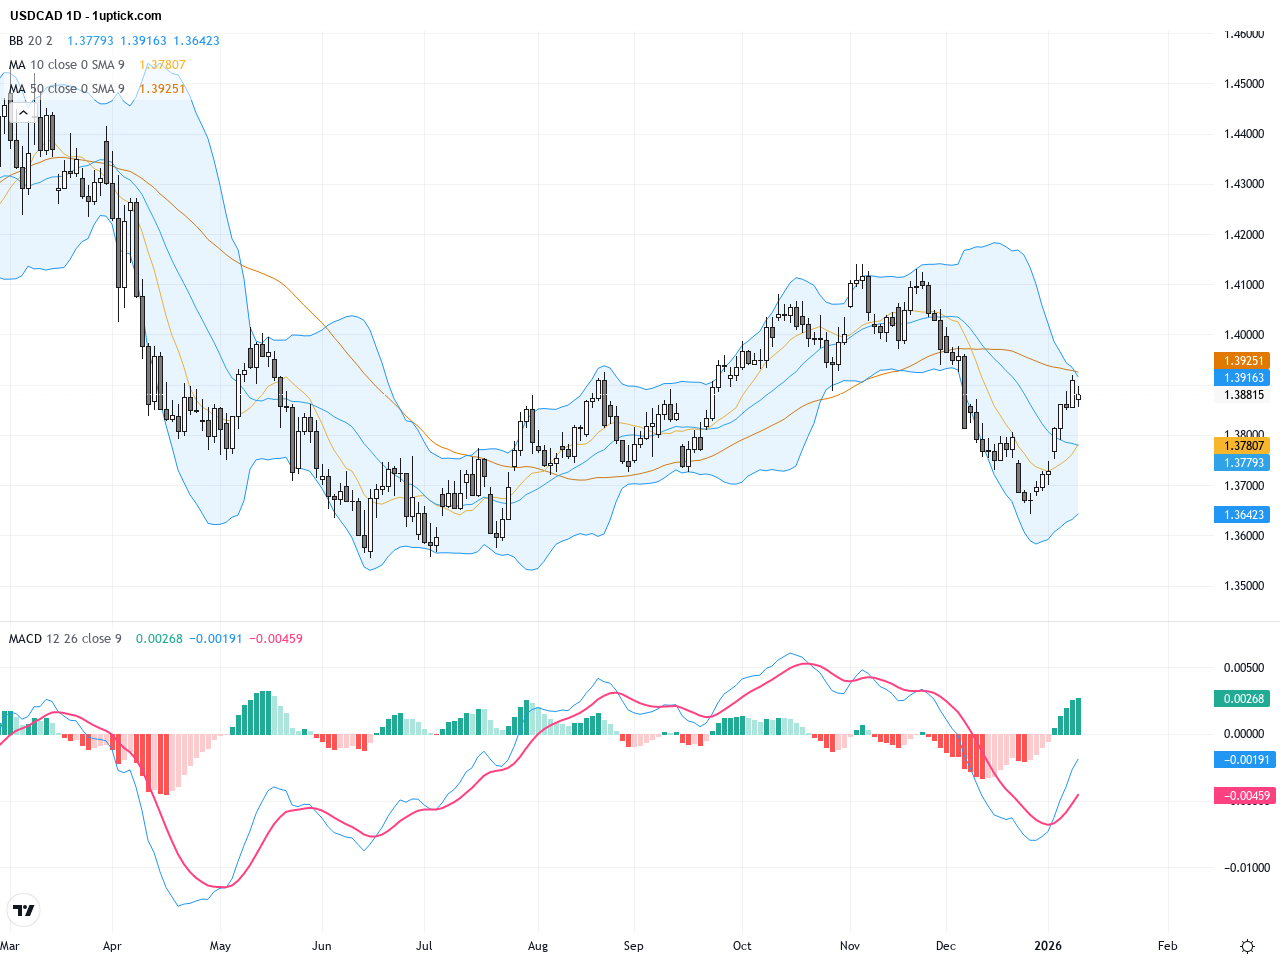
The USDCAD daily chart reveals sideways price action after a decline from recent highs, ranging between approximately 1.38 and 1.39. The 20-day moving average acts as a key support near 1.386, with prices repeatedly bouncing off this level. The MACD oscillator hovers near the zero line, reflecting weak momentum and the absence of a clear directional trend. Overall, the daily outlook suggests consolidation, and a decisive break above 1.3900 resistance is needed to confirm a bullish continuation.
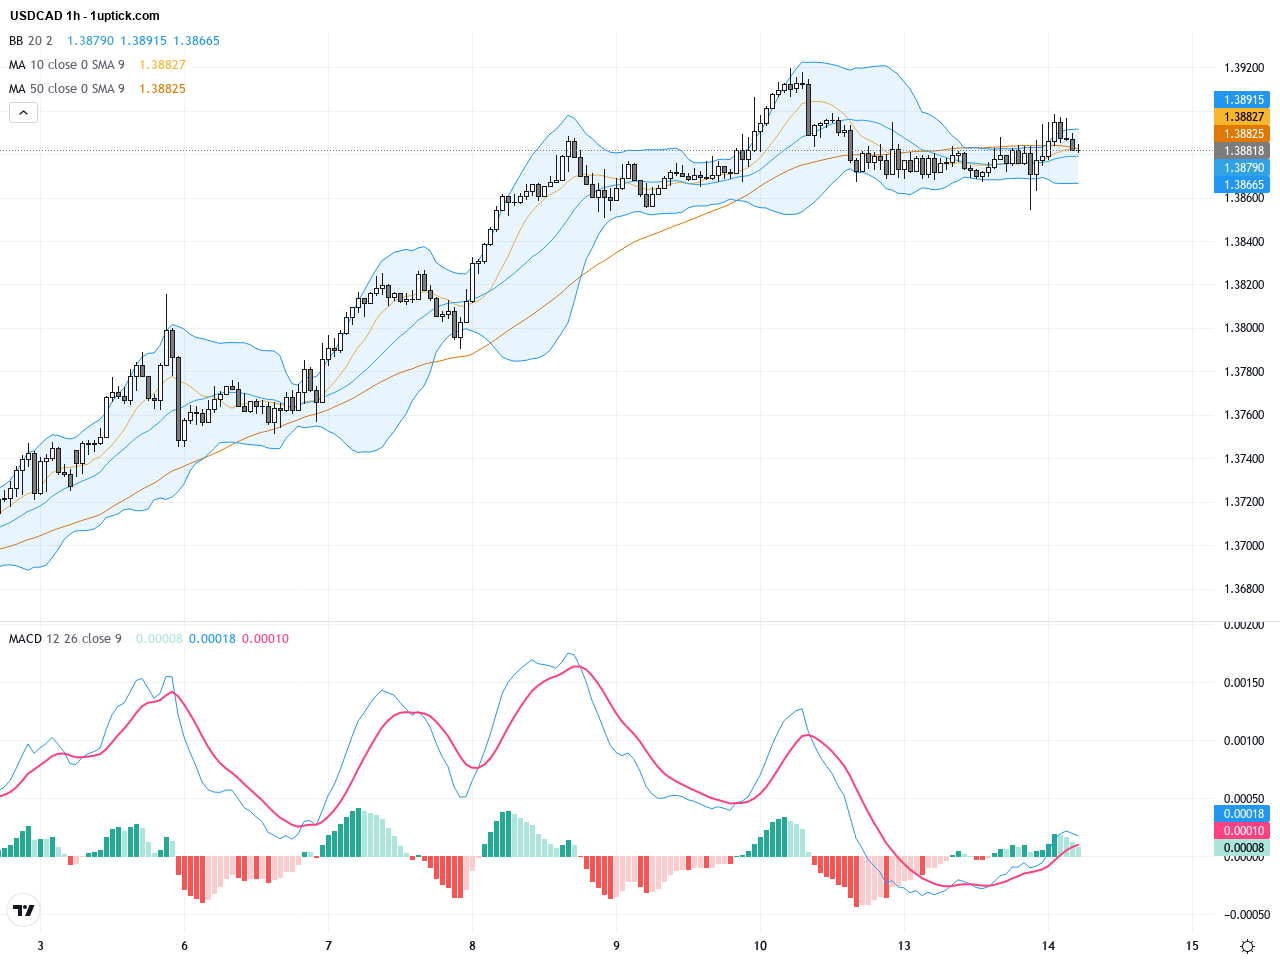
The hourly chart over the past 3-5 days shows USDCAD oscillating between 1.385 and 1.389, with short-term moving averages frequently crossing, indicating indecisive momentum. Bollinger Bands are tightening, signaling an impending volatility expansion. Recently, a Morning Star candlestick pattern emerged, suggesting a potential short-term bullish reversal. This, coupled with a strengthening MACD histogram, points toward rising short-term buying pressure, provided the 1.385 support holds firm.
Technical Trend: USDCAD is exhibiting cautious sideways consolidation, with traders watching closely for a breakout to set the next directional trend.
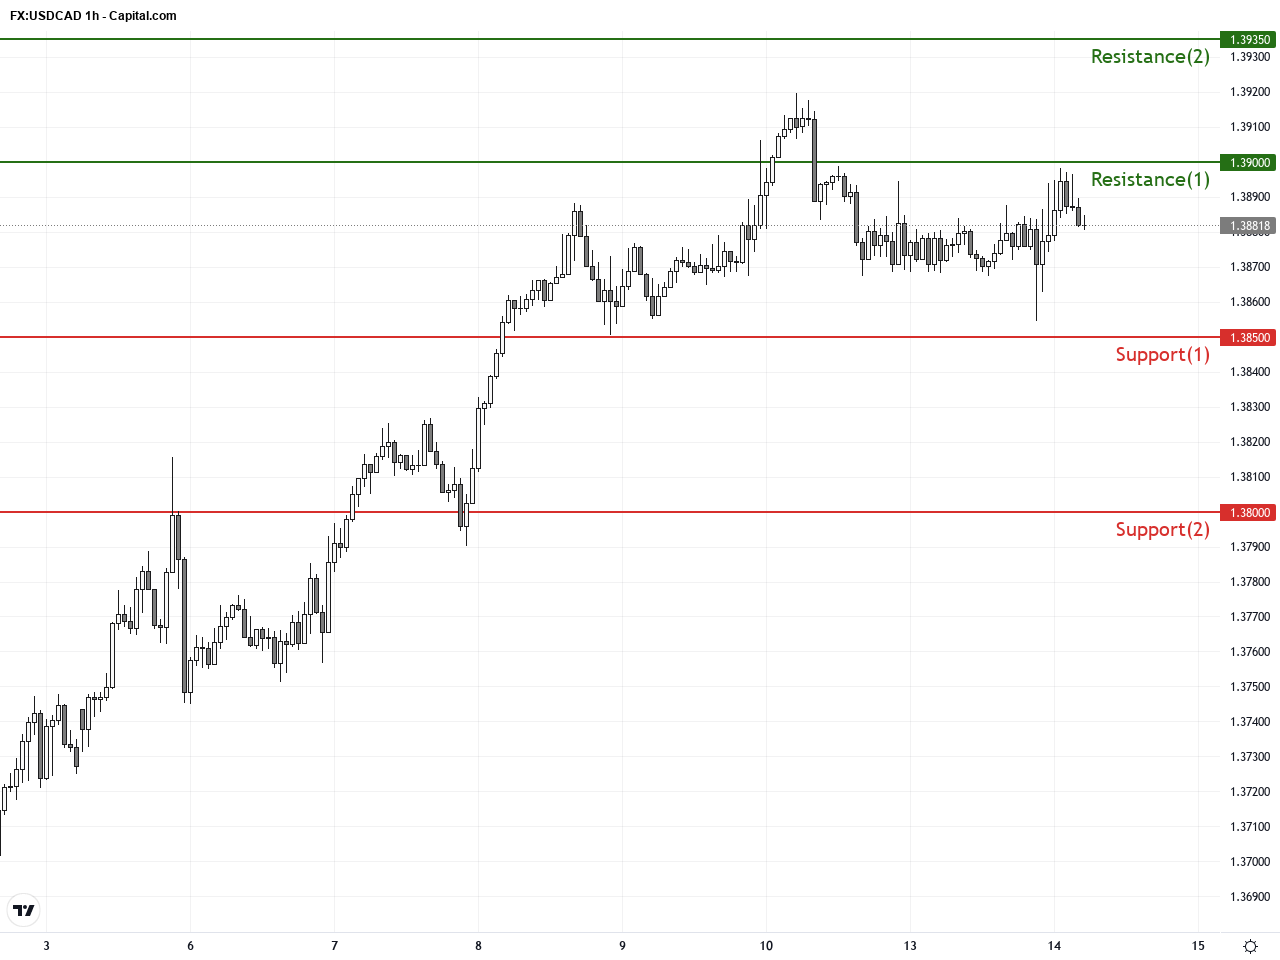
USDCAD currently trades in a well-defined consolidation range, with 1.3900 serving as the key resistance level. The MACD remains close to neutral, underscoring the tug-of-war between bulls and bears. The recent Morning Star candlestick pattern combined with increasing MACD histogram momentum suggests a potential short-term bounce. However, the narrowing Bollinger Bands imply a breakout could occur soon, so traders should look for volume confirmation to avoid false moves. The RSI does not indicate overbought or oversold conditions, emphasizing the importance of strict risk management.Today’s economic calendar includes the critical US December Consumer Price Index (CPI) release at 14:30 CET (22:30 HKT), which is central to USDCAD movement. The market consensus expects the inflation rate to remain steady at 2.7% YoY. If the data meets expectations, the US dollar is likely to sustain or gain strength, benefiting USDCAD. Conversely, any surprises could trigger volatility. Additionally, weaker Canadian building permits data adds pressure to the Canadian dollar. Until these data points are released, traders should adopt a cautious approach.
Resistance & Support
The above financial market data, quotes, charts, statistics, exchange rates, news, research, analysis, buy or sell ratings, financial education, and other information are for reference only. Before making any trades based on this information, you should consult independent professional advice to verify pricing data or obtain more detailed market information. 1uptick.com should not be regarded as soliciting any subscriber or visitor to execute any trade. You are solely responsible for all of your own trading decisions.
Latest Technical Analysis
Latest Insightz