 |
| Gold V.1.3.1 signal Telegram Channel (English) |
USDCAD: Oil Boosts Loonie Rally Amid Technical Pullback
2026-01-30 @ 02:41
Over the past 24 to 48 hours, the US Dollar to Canadian Dollar (USDCAD) has displayed a notable downward trajectory, declining from the previous day’s close of 1.35548 to near the crucial psychological level of 1.3500. The Canadian Dollar’s strength during this period mainly stems from rising oil prices and the Bank of Canada (BoC) holding interest rates steady, both factors signaling confidence in the Canadian economy.
Market attention has recently been on Federal Reserve Chair Powell’s comments and US initial jobless claims data, which provided slight uplift for the US Dollar. However, the broader trend favors the Canadian Dollar thanks to a bullish oil market and BoC’s cautious yet flexible policy stance. This environment pushed USDCAD to its lowest mark in 15 months.
For everyday investors, this price action highlights how sensitive the market is to energy prices and major central bank policies. Oil prices serve as a key indicator for the Canadian Dollar, given Canada’s economic reliance on oil exports. The current uptrend in oil prices and the weak US Dollar together are driving the USDCAD lower. Simply put, holding Canadian Dollars may prove advantageous amid this strengthening trend.

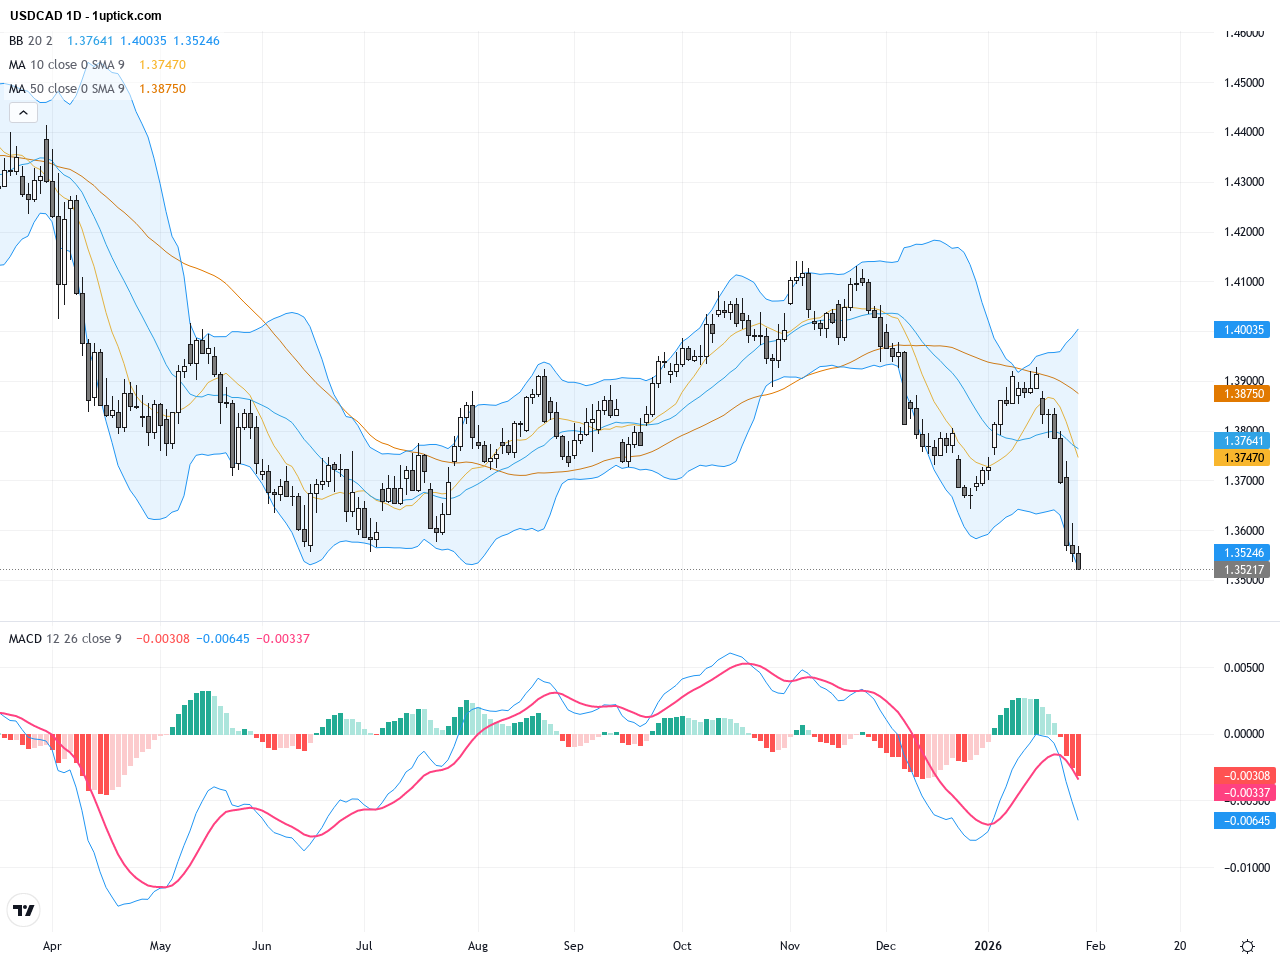
The daily chart illustrates a pronounced downtrend in USDCAD since late last year, currently trading below both the 50-day and 200-day moving averages, indicating sustained bearish momentum over the medium to long term. The Bollinger Bands are tightening, signaling lower volatility in the near term, while the MACD remains in a bearish crossover with downward momentum. Overall, the trend channel remains bearish, suggesting the potential for further declines unless a reversal pattern emerges.
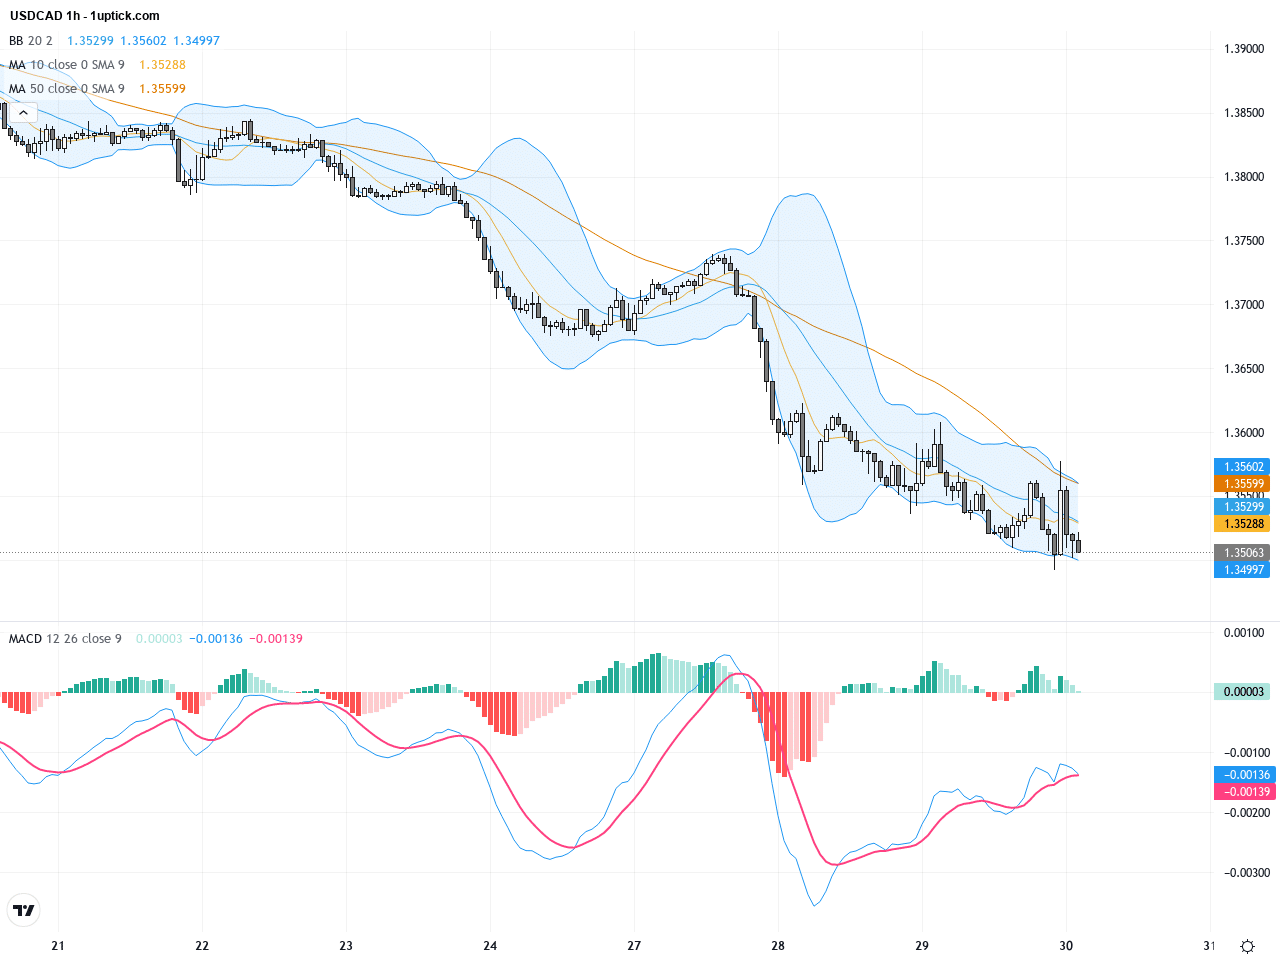
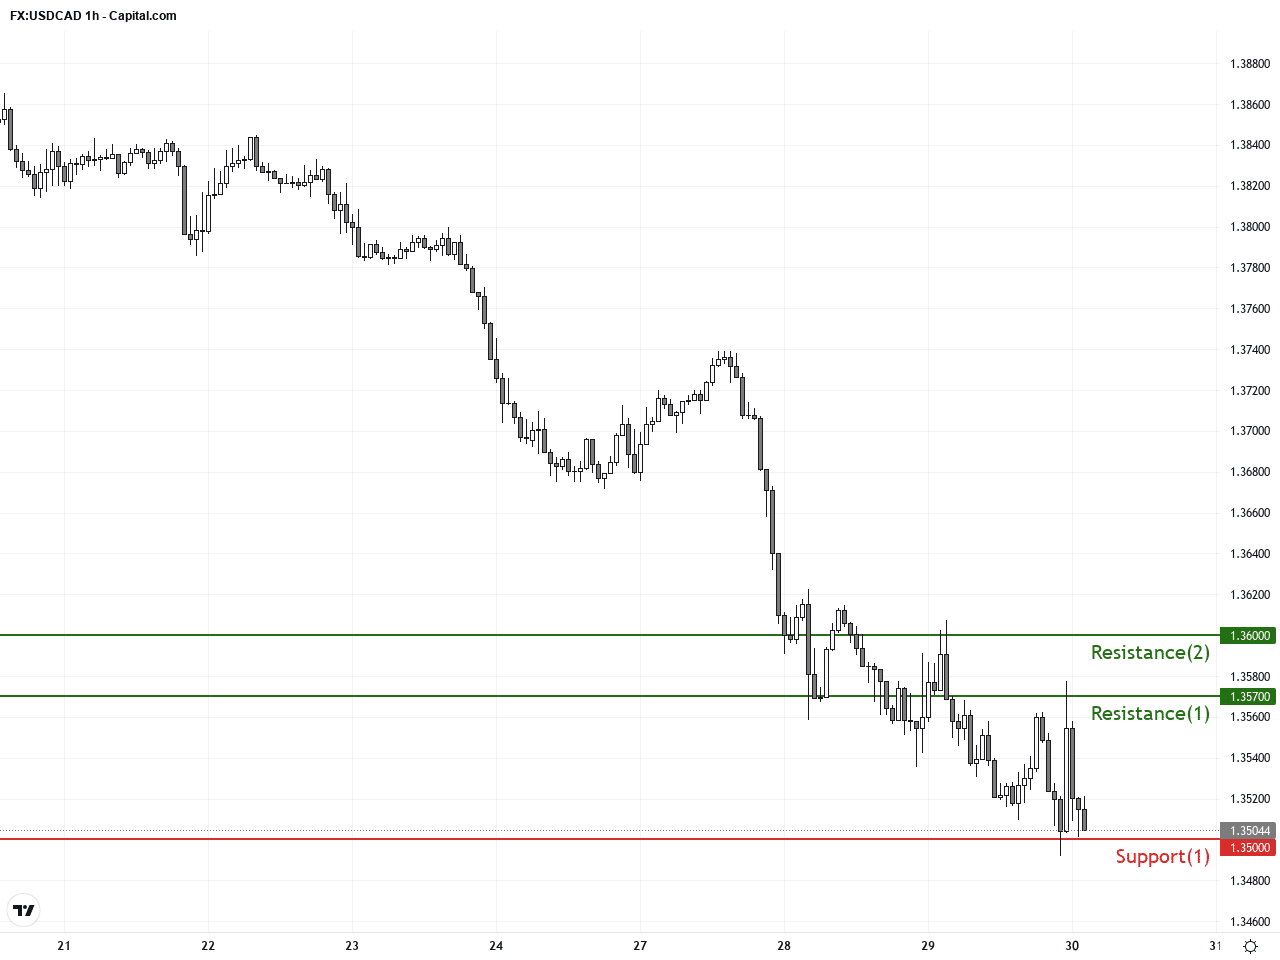
On the hourly chart, USDCAD has experienced a recent pullback after several days of steady declines, with prices testing support near 1.3500 multiple times. The short-term moving averages are starting to show a bullish crossover, hinting at a possible short-term recovery. The MACD histogram is shrinking with the MACD lines converging, indicating a consolidation phase is likely where price oscillates between established support and resistance levels.
Technical Trend: Cautiously bearish consolidation phase
Technically, USDCAD remains in a firm bearish structure on the daily timeframe with MACD bearish crossover and the price positioned below major moving averages indicating downward momentum. The short-term hourly chart signals a possible corrective rebound, offering tactical buying opportunities on dips close to support, but caution is warranted near resistance zones where selling pressure may intensify. Trading volume remains steady and rising oil prices continue to underpin the Canadian dollar, making energy market developments crucial for future USDCAD moves.There are no significant or directly impactful economic events scheduled today that would affect USDCAD decisively. Canada’s trade balance data, released at 14:30 GMT+1, is expected to show a continued deficit, which could maintain some pressure on the Canadian dollar. Meanwhile, multiple US reports at the same time (such as non-farm productivity and durable goods orders) might strengthen the dollar if results surpass forecasts, potentially providing short-lived support to USD/CAD. However, given prevailing focus on oil prices and central bank policies, expected price movements are likely to be moderate.
Resistance & Support
The above financial market data, quotes, charts, statistics, exchange rates, news, research, analysis, buy or sell ratings, financial education, and other information are for reference only. Before making any trades based on this information, you should consult independent professional advice to verify pricing data or obtain more detailed market information. 1uptick.com should not be regarded as soliciting any subscriber or visitor to execute any trade. You are solely responsible for all of your own trading decisions.