


 |
| Gold V.1.3.1 signal Telegram Channel (English) |
USDCAD: Strong US Data Supports Steady 1.3900 as Technicals Signal Short-Term Volatility
2026-01-15 @ 13:02
In the past 24 to 48 hours, USD/CAD maintained a mild upward trend, stabilizing near yesterday’s closing price of 1.39025. During the Asian trading session, the pair hovered around 1.3890, trading close to the key 1.39 level. Strong recent U.S. economic data, especially retail sales and Producer Price Index (PPI) figures, have bolstered market expectations for a Federal Reserve pause in rate hikes, serving as the main driver behind the stronger U.S. dollar.
Reports highlighted a cautious outlook on Fed policies amid U.S. core inflation holding steady at 2.7%, which maintained the dollar’s appeal. Meanwhile, stable Canadian economic performance coupled with firmer oil prices provided necessary support for the Canadian dollar, preventing significant swings in the exchange rate. The dollar’s momentum, however, failed to break past the 1.40 level, reflecting a tug-of-war sentiment in the market – much like a silent stall awaiting crucial data revelations.
For the average investor, this currency duel between the U.S. dollar and the Canadian dollar underscores ongoing global economic uncertainties. The dollar’s strength is influenced not only by domestic indicators but also by the performance of Canada’s economy and oil market dynamics. Recent market developments and price movements serve as a reminder that exchange rate fluctuations remain subjected to multiple forces, and upcoming U.S. nonfarm payroll reports hold the key to the next directional move.

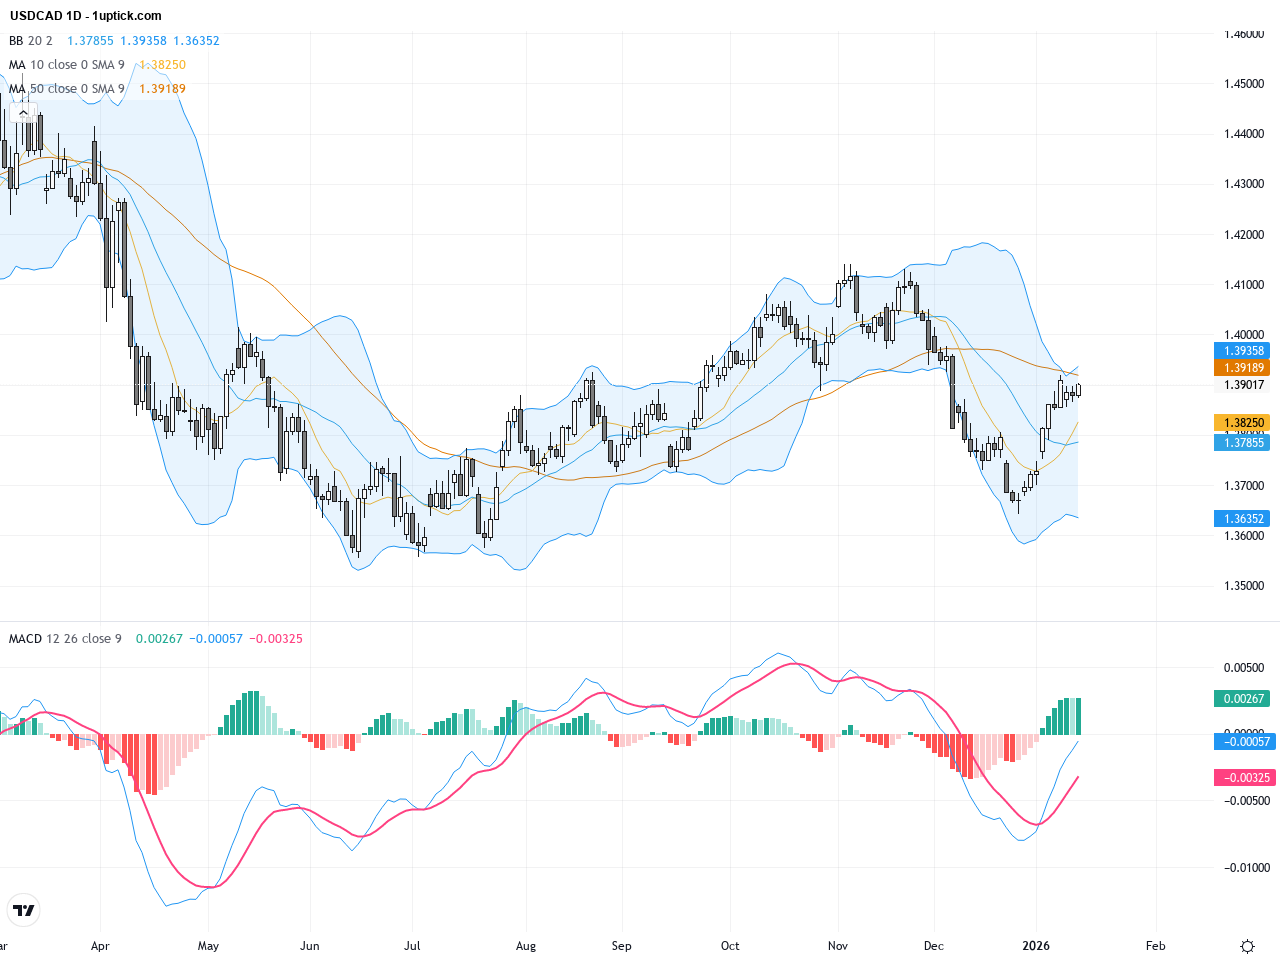
The daily chart shows USDCAD in a gradual uptrend since late December, with the price consistently trading above the 50-day and 200-day moving averages, signaling strong medium to long-term bullish momentum. Bollinger Bands are narrowing as price hovers near the middle band, indicating consolidation ahead of a potential breakout. MACD shows mild bullish momentum supporting further upside. The overall trend is firmly upward, suggesting prospects for testing the psychological 1.4000 resistance zone soon.

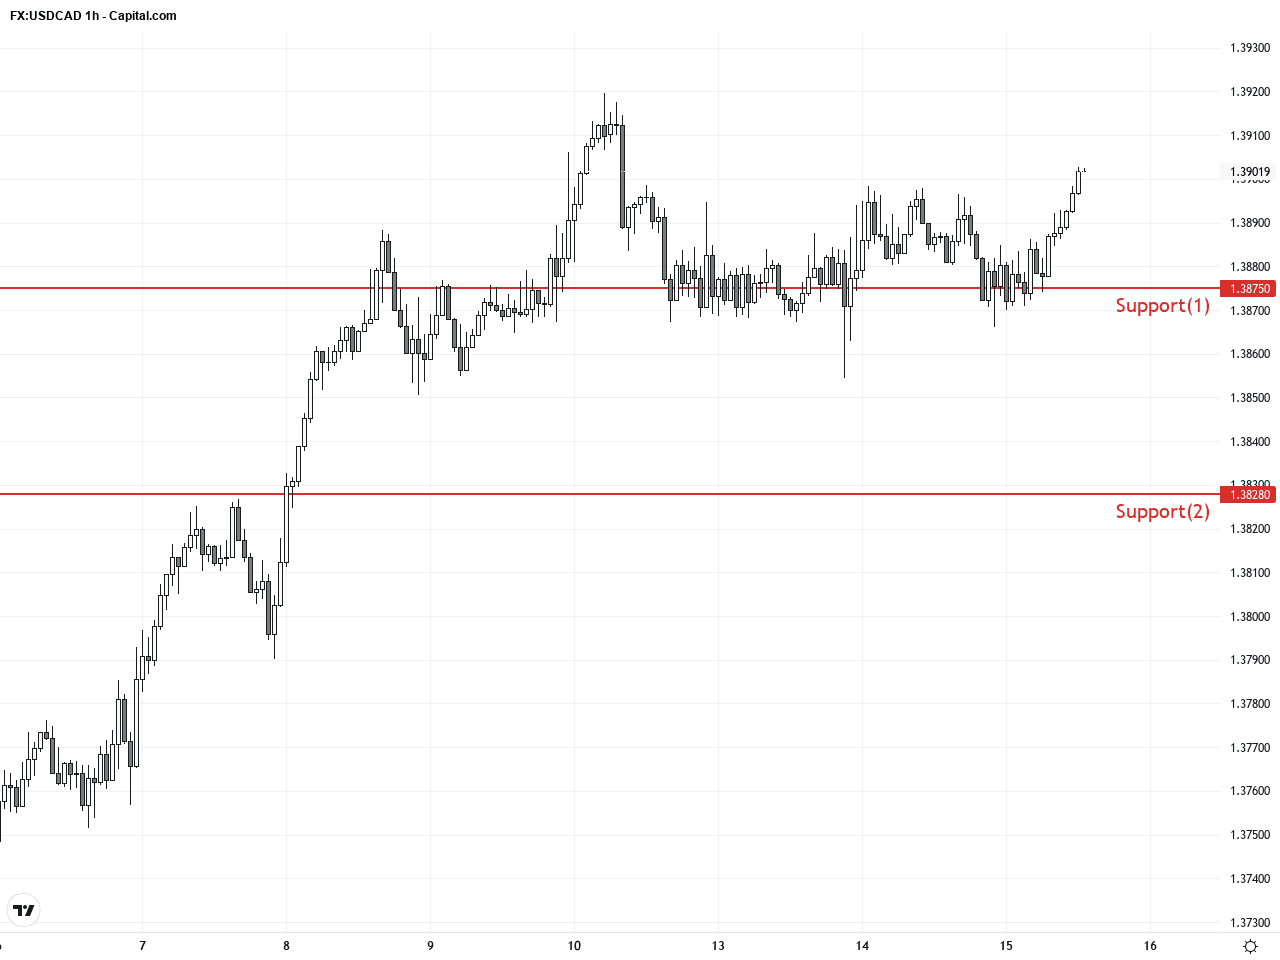
On the hourly chart covering the past 3-5 days, USDCAD demonstrates a consolidating upward trajectory, oscillating between the Bollinger Bands’ middle and upper bands, implying slight bullish dominance. Short-term moving averages are converging with a recent golden cross, fueling short-term bullish sentiment. MACD histogram is shrinking but remains positive, confirming momentum. A minor ascending flag pattern is developing, whose breakout could accelerate a move towards 1.3950 and 1.4000 resistance levels. Some pullback risks exist, but short-term bullish cues prevail.
Technical Trend: Cautiously bullish trend, with the market balancing between persistent buying pressure and short-term consolidation.
Technically, daily momentum remains robust with bullish moving average alignment supporting continuation. The hourly chart’s formation of an ascending flag pattern suggests a likely breakout shortly. Yesterday’s bullish engulfing candlestick indicates renewed buying interest for at least the coming 24 hours. Bollinger Bands tightening could precede a volatility surge. Without MACD divergence, the setup favors bulls for a test of resistance near 1.3950-1.4000. Traders should watch for confirmed breakout signals to enter or add to positions.Today’s economic calendar (GMT+1) lacks direct Canadian or US data impacting USDCAD until the afternoon US session. Key releases include the Philadelphia Fed Manufacturing Index, NY Empire State Manufacturing Index, and weekly jobless claims at 14:30 GMT+1 (22:30 HKT). Better-than-expected readings could boost the dollar and propel USDCAD higher. Conversely, weaker data might pressure the USD, causing a possible pullback. Traders should be cautious around these events for potential short-term volatility.
Resistance & Support
The above financial market data, quotes, charts, statistics, exchange rates, news, research, analysis, buy or sell ratings, financial education, and other information are for reference only. Before making any trades based on this information, you should consult independent professional advice to verify pricing data or obtain more detailed market information. 1uptick.com should not be regarded as soliciting any subscriber or visitor to execute any trade. You are solely responsible for all of your own trading decisions.