


 |
| Gold V.1.3.1 signal Telegram Channel (English) |
USDCAD Technical Analysis: Key Breakdown Below 1.35 Amid Strong Oil Prices and BoC Rate Pause
2026-01-30 @ 02:53
Over the past 24 to 48 hours, the USD/CAD exchange rate has seen a significant decline, closing yesterday at 1.34953, marking its lowest level in 15 months since October 2024. The market drivers include the Bank of Canada (BoC) holding interest rates steady, coupled with rising oil prices that strengthened the Canadian dollar, while the US dollar weakened under pressure.
Moreover, comments from Federal Reserve Chair Powell and recent initial jobless claims data caused some fluctuations in the US Dollar Index, but the overall trend remains soft. Investors generally anticipate a US economic rebound, but current uncertainties around pandemic effects and economic indicators limit the dollar’s bounce, pushing the USD/CAD rate lower.
In simple terms for the average investor, the sharp drop in USD/CAD reflects Canada’s robust oil prices and stable monetary policy boosting the loonie, while the US dollar remains relatively weak for the moment. This dynamic means US dollar holders face short-term currency risk, while Canadian dollar assets benefit from the current setup.
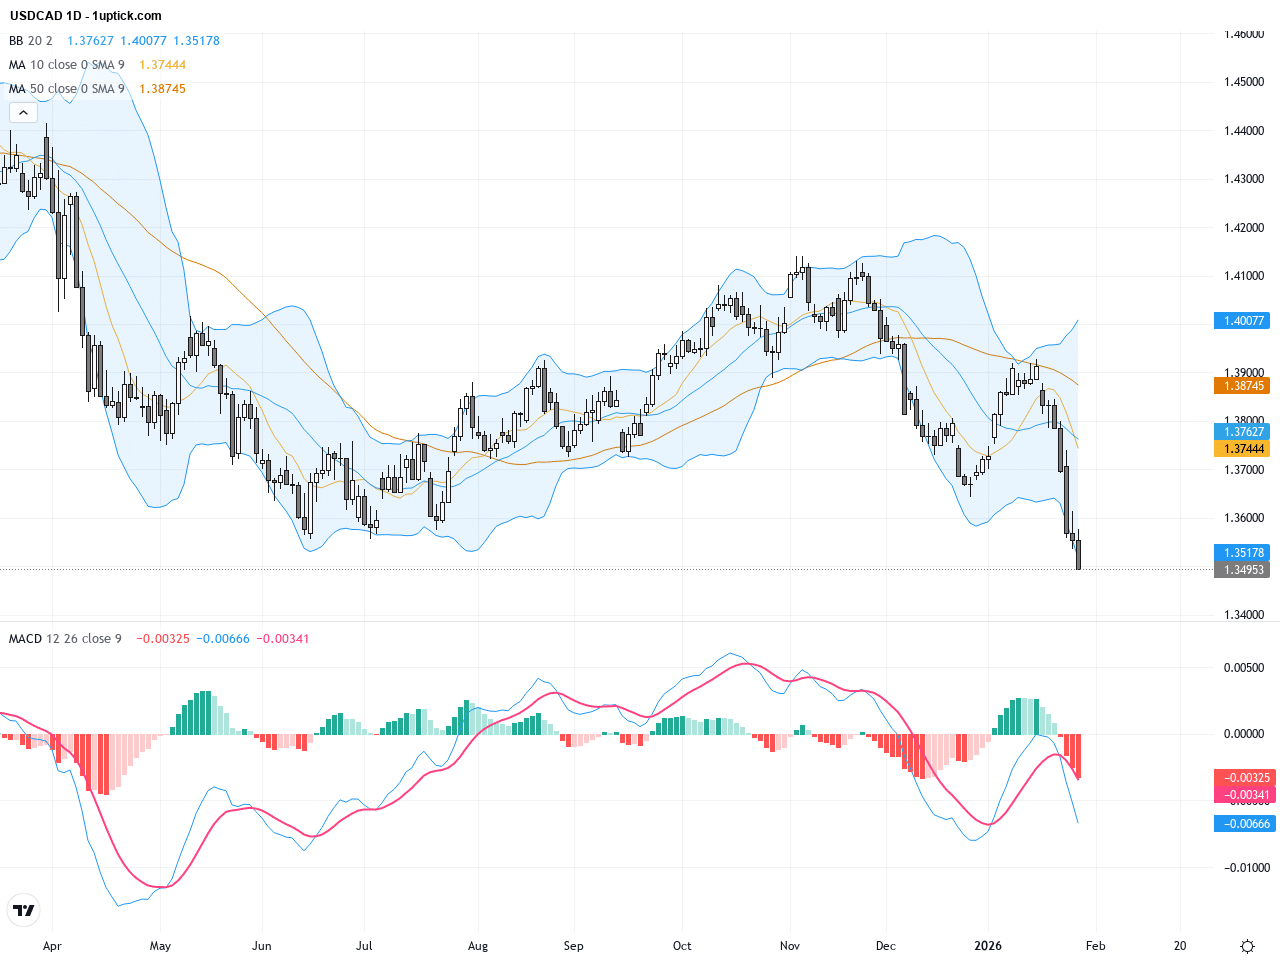
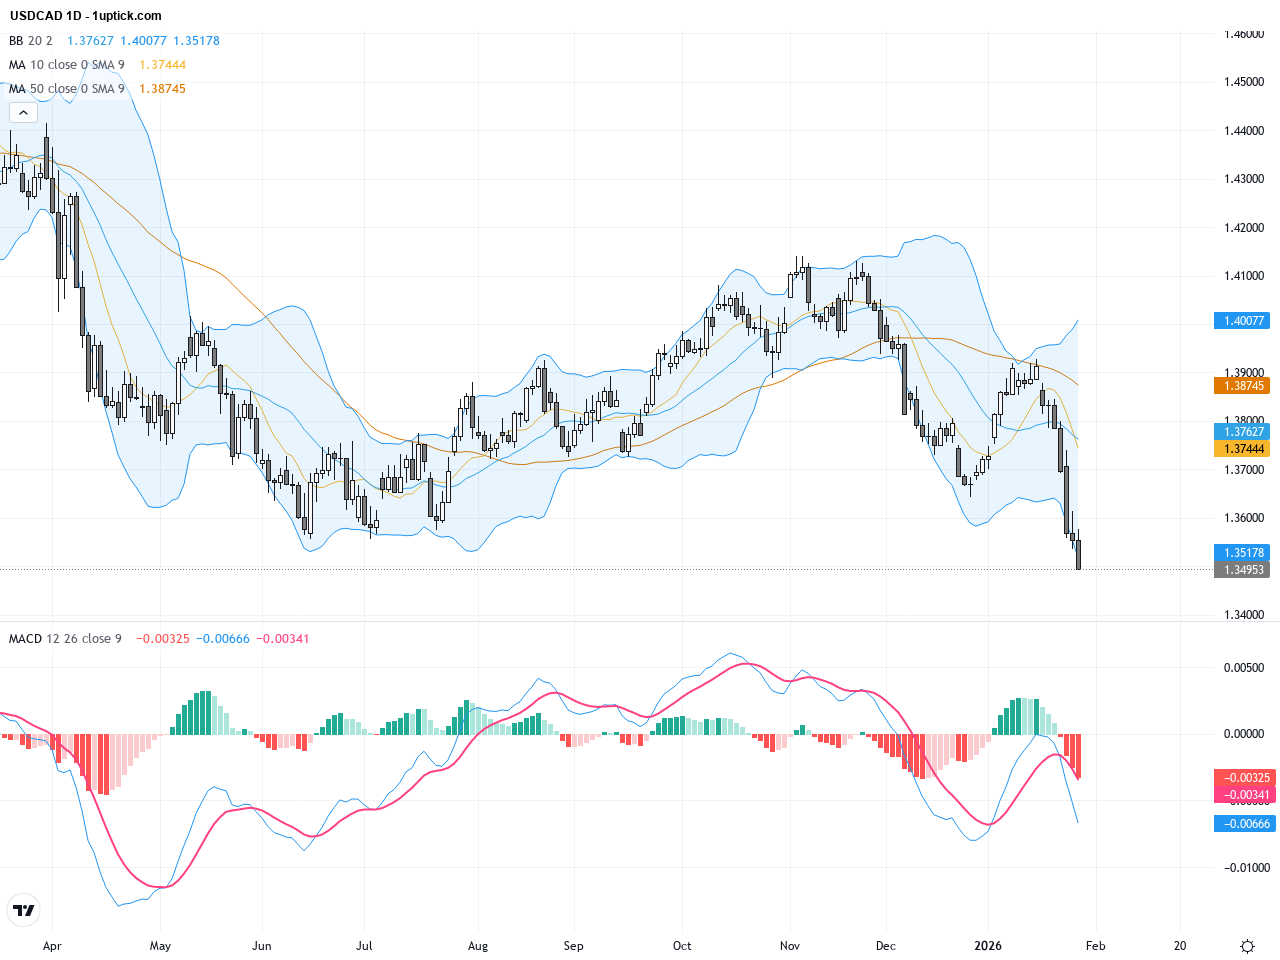
The daily chart of USDCAD reveals a sustained downtrend over recent weeks, with prices consistently trading below the 50-day and 200-day moving averages, signaling a prolonged bearish bias. Bollinger Bands are contracting, indicating decreasing volatility, while the MACD remains in negative territory and in a widening trend, confirming strong downward momentum. The recent break below the 1.3550 support level suggests further downside risk targeting the 1.3400 area. Overall, the technical outlook remains bearish with cautious risk appetite.

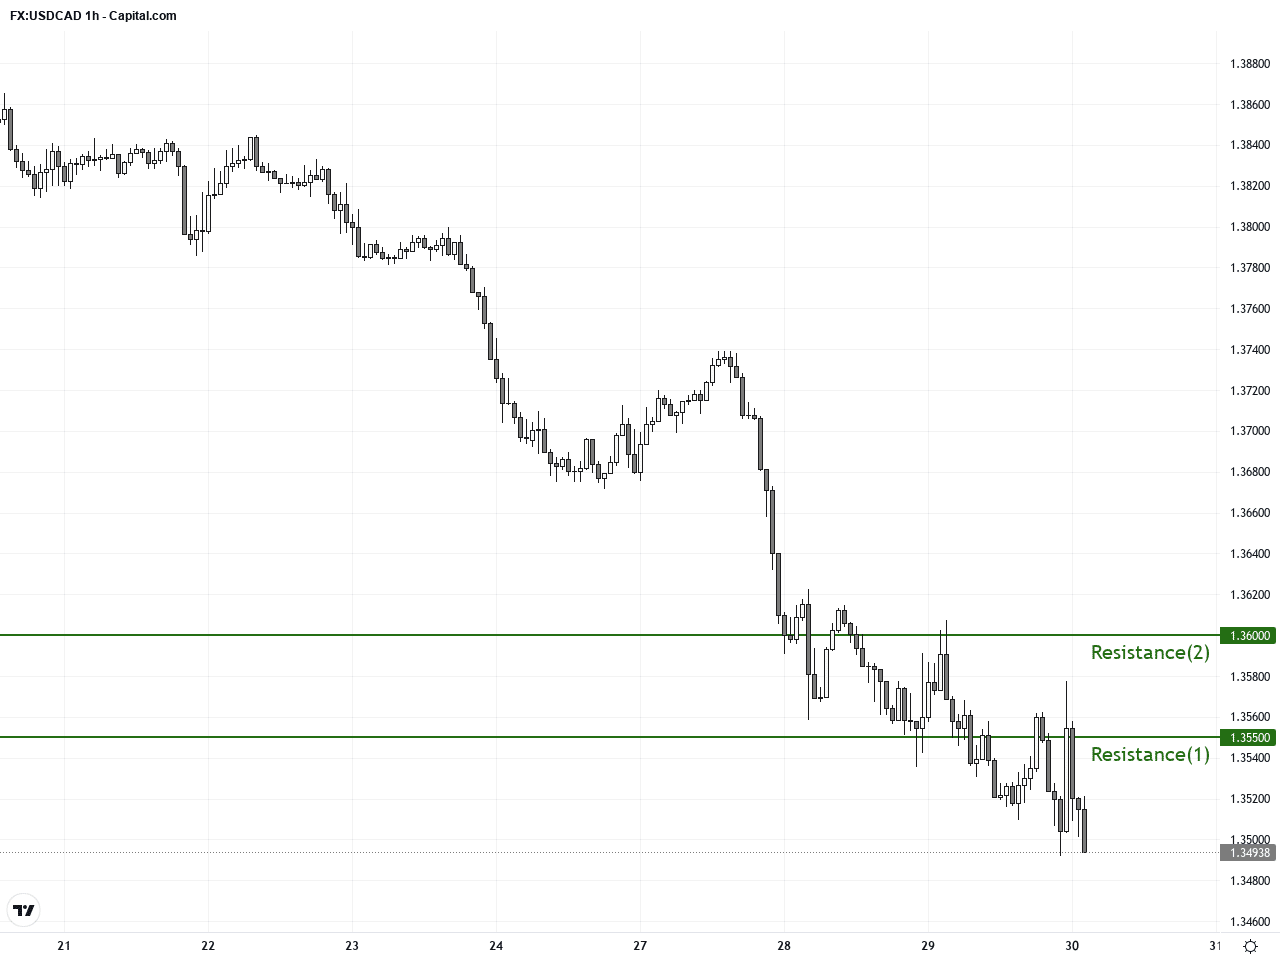
The hourly chart displays a sharp decline over the last 3 to 5 days, with prices tracking close to the lower Bollinger Band and exhibiting a MACD bearish crossover. The death cross between the 23 and 50-period moving averages confirms short-term selling pressure. Rising volume amplifies the bearish momentum, and recent bearish engulfing candlesticks indicate failed bullish attempts to recover, signaling ongoing downside risks.
Technical Trend: The trend is decisively bearish.
Technically, the pair shows strong bearish momentum marked by a MACD death cross and expanded Bollinger Bands confirming selling pressure. Both daily and hourly moving averages are aligned bearish, with resistance levels holding firm. Traders should avoid premature long entries and watch for a break below the critical 1.3450 support to signal accelerated downside risk. Additionally, watch out for reversal candlestick signals such as bullish engulfing or hammer formations to identify potential short-term bounces.Today’s economic calendar shows the Canadian trade balance for November releasing at 14:30 GMT+1, with an expected larger deficit of -0.7 billion CAD, potentially weighing on the CAD. Simultaneously, multiple key US economic indicators including non-farm productivity, weekly jobless claims, and trade balance will be announced. Positive surprises in US data could support the USD, while weaker numbers may dampen its strength. Overall, these data points could add volatility to USD/CAD, so traders should monitor closely for directional cues.
Resistance & Support
The above financial market data, quotes, charts, statistics, exchange rates, news, research, analysis, buy or sell ratings, financial education, and other information are for reference only. Before making any trades based on this information, you should consult independent professional advice to verify pricing data or obtain more detailed market information. 1uptick.com should not be regarded as soliciting any subscriber or visitor to execute any trade. You are solely responsible for all of your own trading decisions.