 |
| Gold V.1.3.1 signal Telegram Channel (English) |
USDCAD Technical Analysis: Key Support and Resistance Levels with Trading Outlook
2026-01-01 @ 08:01
Over the past 24 to 48 hours, the USD/CAD pair has shown notable volatility, with prices retreating slightly from yesterday’s close of 1.3721 before attempting to hold above the 1.3650 level. This price movement was primarily driven by strong U.S. labor market data that bolstered the U.S. dollar, pushing the pair higher. However, rising oil prices provided support to the Canadian dollar, limiting further gains and causing the pair to hover around the 1.3700 mark with increased oscillations.
Recent market news highlights that despite the upward trend spurred by robust U.S. labor figures, USD/CAD faces potential pitfalls such as cooling U.S. inflation and diverging monetary policy outlooks between the Federal Reserve and the Bank of Canada. The dollar’s regained strength has helped extend a three-day recovery near 1.3700, yet the sustainability of this bullish momentum remains uncertain.
For the average investor, the recent USD/CAD fluctuations resemble a tug of war awaiting a critical policy decision, with the U.S. dollar and Canadian dollar jostling for dominance. The strong labor market data has fueled the dollar’s ascent while rising oil prices have reinforced the loonie’s defense. Investors should remain cautious and stay tuned to upcoming economic releases and central bank communications as these will be key drivers of the pair’s near-term direction.

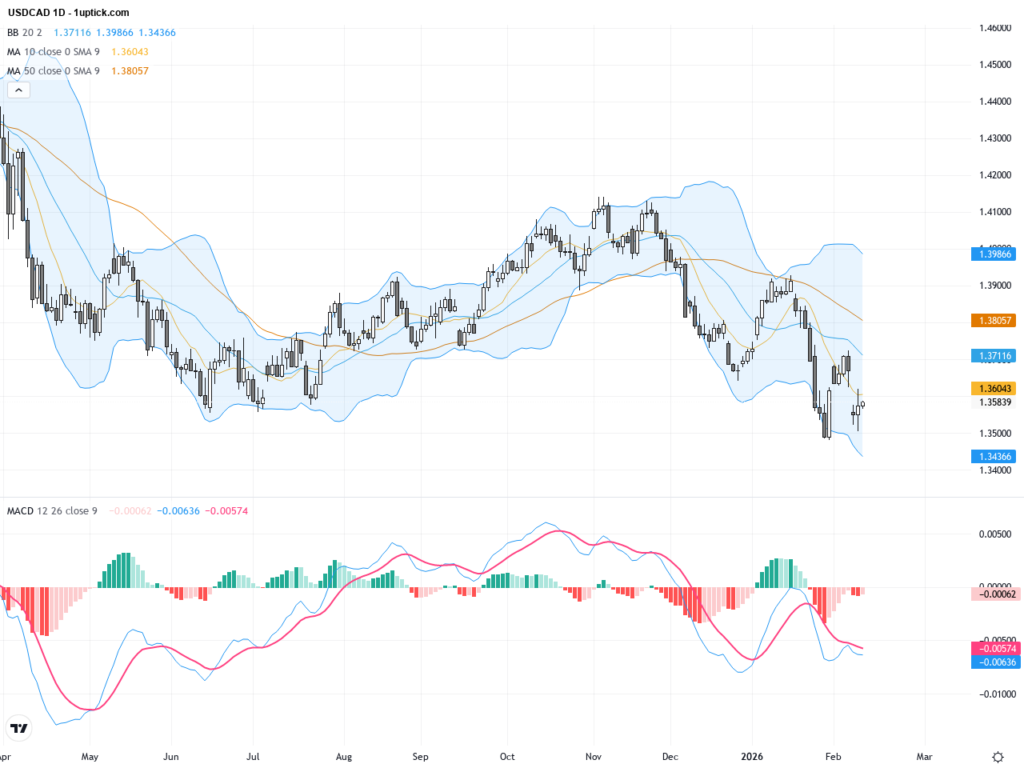
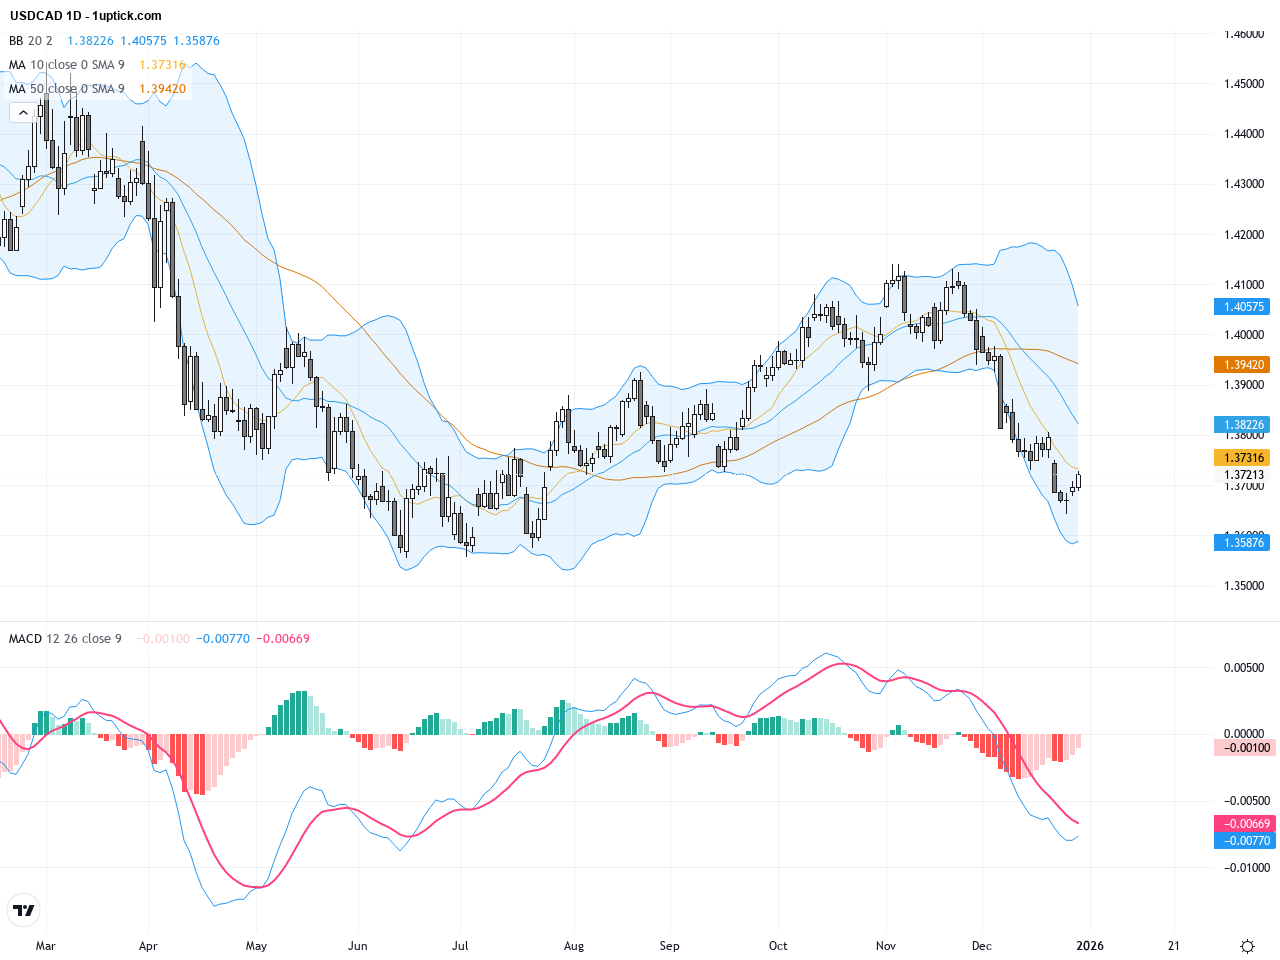
The daily chart reveals a general downward oscillation over the past period, with a slight rebound yesterday but still trading below the 50-day and 200-day moving averages, indicating bearish pressure persists. Bollinger Bands are narrowing, signaling declining volatility, while the MACD remains below the zero line, maintaining a bearish bias. The pair is attempting to hold above the key support around 1.3650, but no clear reversal is visible yet. Traders should monitor upcoming price action for potential breakout or breakdown cues to determine medium-term trend direction.
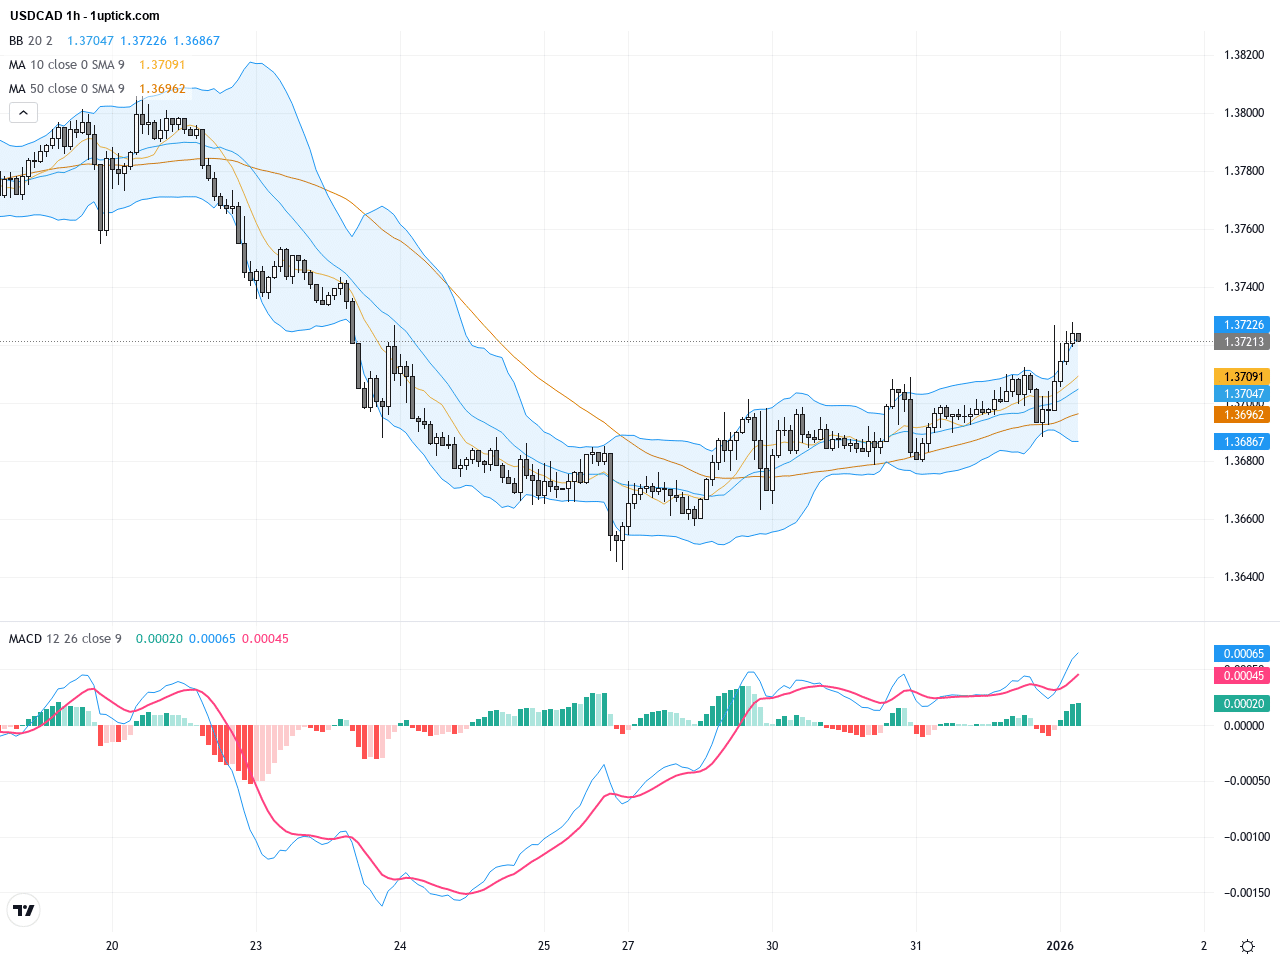
The hourly chart over the past 3-5 days shows increased price fluctuations, oscillating between 1.3680 and 1.3720. Bollinger Bands have slightly expanded, short-term moving averages (5-hour and 10-hour MAs) have recently crossed, and the MACD histogram indicates gaining bullish momentum. However, the pair has yet to breach the critical resistance at 1.3750, suggesting cautious trading as potential pullbacks remain a risk. Short-term traders should watch for breakout confirmation before entering significant positions.
Technical Trend: USDCAD currently exhibits a cautiously bullish rebound within an overall consolidation phase, recommending traders adopt a wait-and-see approach with a focus on short-term buying on dips.
Technically, the MACD is nearing a bullish crossover, indicating potential momentum shift upwards. Short-term moving averages are showing crossover signals, strengthening buy-side momentum. Price action hovers near the middle Bollinger Band on the daily chart, indicating a critical decision zone. A triple bottom pattern has recently formed, suggesting strong support and possible upcoming rebound. A bullish engulfing candlestick pattern was spotted, signaling improved near-term market sentiment favorable for bulls.Today’s economic calendar highlights key US events at 14:30 and 16:30 GMT+1, including Weekly Jobless Claims and Crude Oil Stocks changes. These data points directly reflect US economic health and are highly relevant to USDCAD. Better-than-expected jobless claims or larger-than-expected oil inventory draws could boost the USD, pushing USDCAD higher. Conversely, weaker data may pressure the dollar. Other events like China’s PMI releases are important but have less direct impact on USDCAD.
Resistance & Support

The above financial market data, quotes, charts, statistics, exchange rates, news, research, analysis, buy or sell ratings, financial education, and other information are for reference only. Before making any trades based on this information, you should consult independent professional advice to verify pricing data or obtain more detailed market information. 1uptick.com should not be regarded as soliciting any subscriber or visitor to execute any trade. You are solely responsible for all of your own trading decisions.