


 |
| Gold V.1.3.1 signal Telegram Channel (English) |

USDCAD Technical Analysis: Key Support Holds, Pair Eyes Rebound Opportunity
2026-01-27 @ 13:02
Over the past 24 to 48 hours, the USD/CAD exchange rate has experienced mild fluctuations, hovering around 1.3720, with minor movement from yesterday’s closing price of 1.37324. Traders are closely eyeing the upcoming Federal Reserve (Fed) and Bank of Canada (BoC) interest rate decisions, with market consensus expecting both central banks to hold rates steady, thus limiting significant price swings.
Furthermore, easing geopolitical tensions combined with reduced US economic and policy uncertainties have helped restore some confidence in the US dollar, partly offsetting the Canadian dollar’s upward pressure. Market participants are also monitoring steady oil prices, given Canada’s status as a major energy exporter, which provides direct support to the Canadian dollar.
To put it simply for the average investor, if you hold USD/CAD positions, the current market environment is relatively stable since no dramatic interest rate changes are anticipated and geopolitical risks have lessened, supporting the US dollar. Overall, this is a wait-and-see period ahead of key central bank decisions, making it critical to watch for future policy signals that may impact the currency pair.
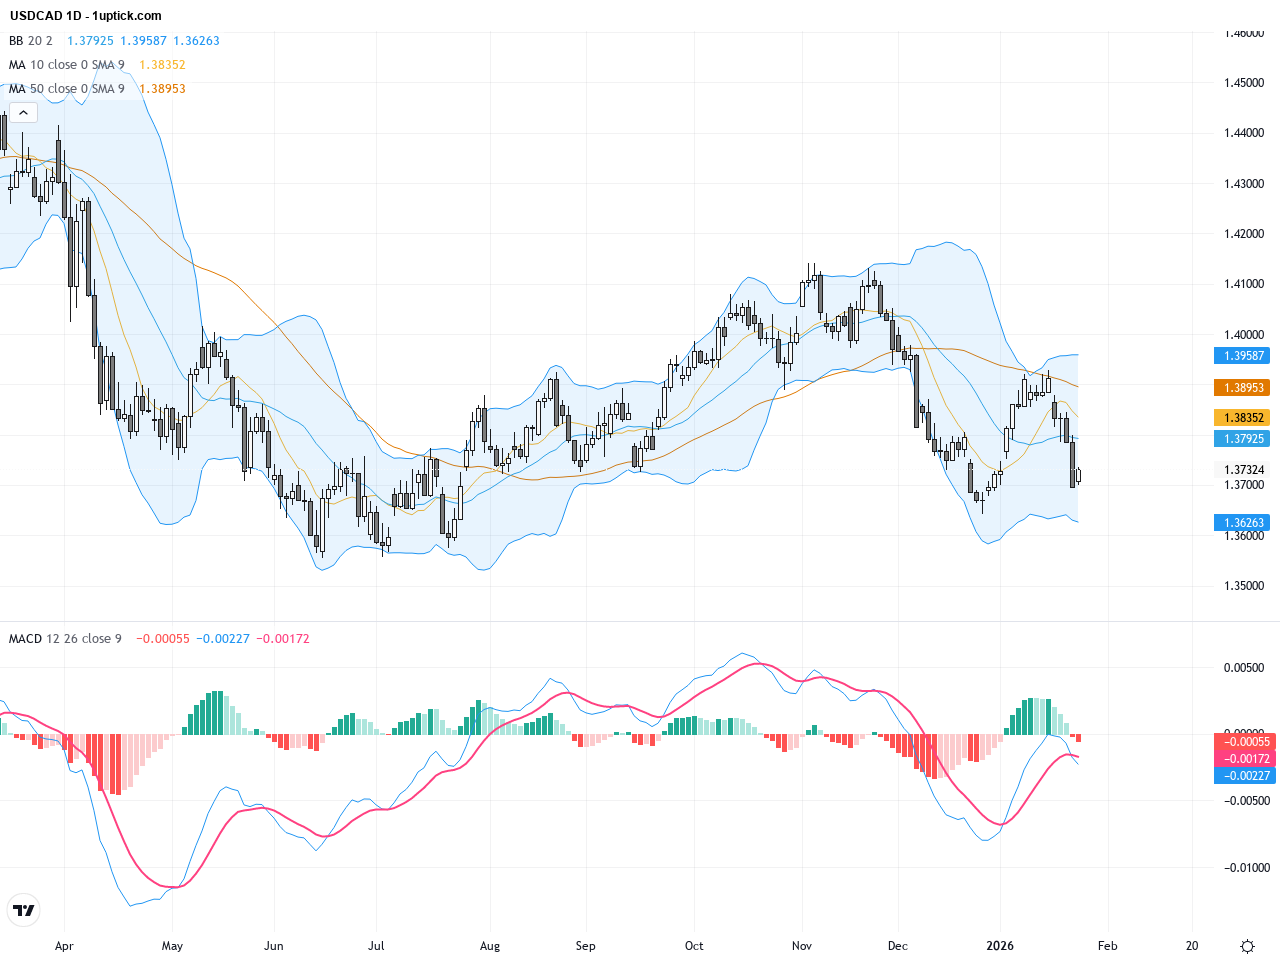
The daily chart reveals a gradually declining trend for USDCAD over the recent period, with prices oscillating within the 1.38 to 1.37 range. The 200-day and 50-day moving averages at 1.3833 and 1.38096 respectively act as resistance levels, signaling ongoing medium to long-term selling pressure. The Bollinger Bands are contracting, implying reduced volatility, while the MACD shows bearish momentum with signs of easing. The pair is currently testing the lower boundary of its descending channel near 1.3650, a key support area.
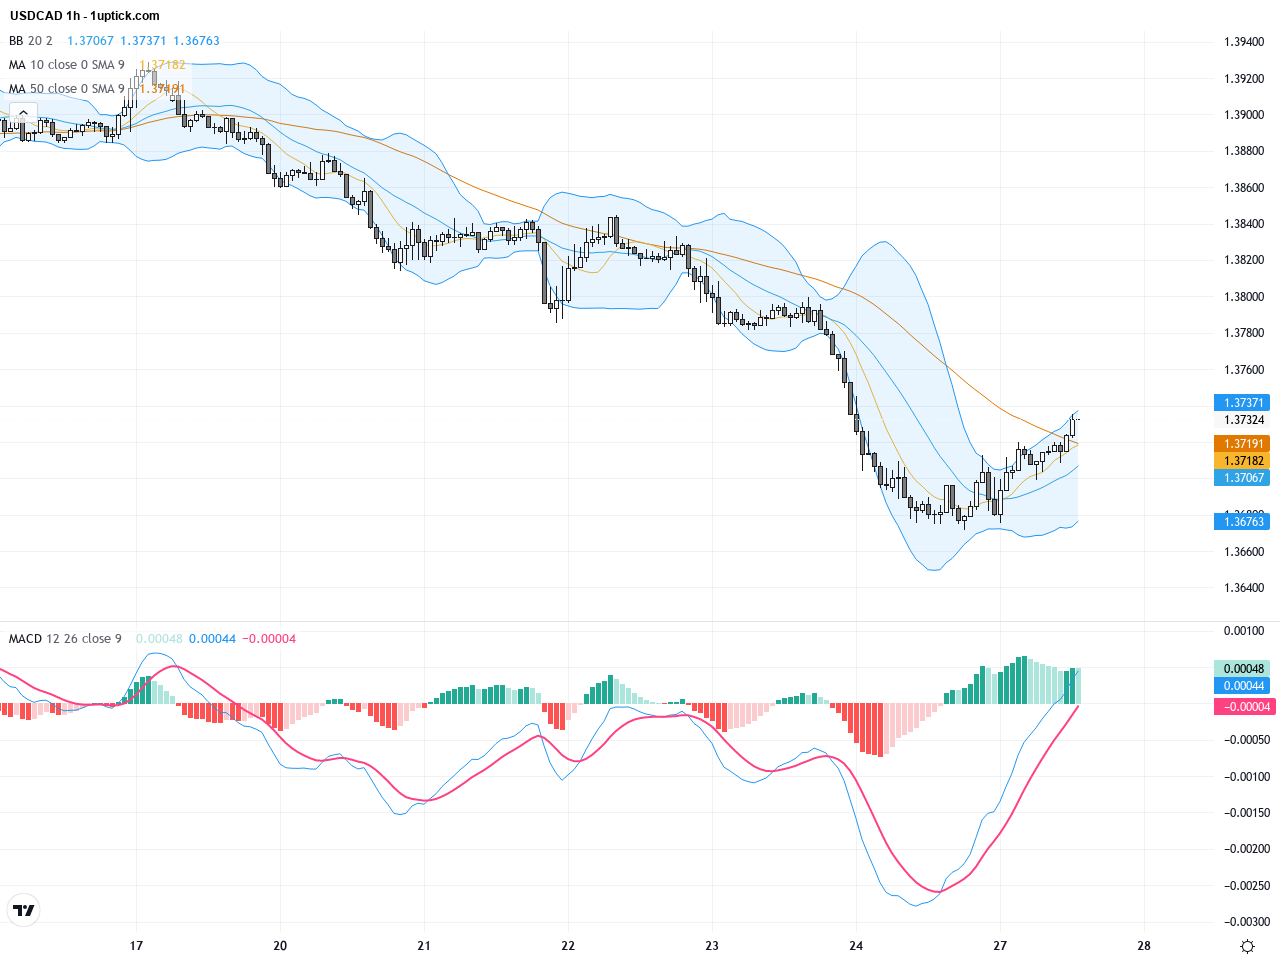
On the hourly timeframe, USDCAD has repeatedly tested support levels between 1.3680 and 1.3720 over the past 3-5 days, showing consolidation within a narrow range. Short and medium-term moving averages are intertwined, and the MACD is beginning to form a bullish crossover, hinting at a potential short-term bounce. Bollinger Bands highlight a low volatility phase, indicating a waiting period for a decisive breakout. A bearish flag pattern recently formed could trigger further declines if broken downwards.
Technical Trend: The current trend is cautiously sideways with a short-term bias to consolidation, while the medium-term outlook retains bearish potential.
Technically, USDCAD is currently testing a crucial support zone, with both daily and hourly charts indicating weakening downward pressure. Recent candlestick patterns, such as long lower shadows, suggest increasing buying interest. The MACD is on the verge of a bullish crossover, signaling a probable short-term bottom. If prices hold above the 1.3650 support level, a fresh bounce could emerge soon, offering a high-probability trading setup.Today’s economic calendar features mostly European and US housing and consumer confidence figures, with no direct impact expected on USDCAD. The upcoming interest rate decisions from the BoC and Fed remain the key upcoming catalyst, but no significant rate or employment data are scheduled for release today. Traders should watch for US consumer confidence and manufacturing data, which will provide clues on the US dollar’s near-term trajectory.
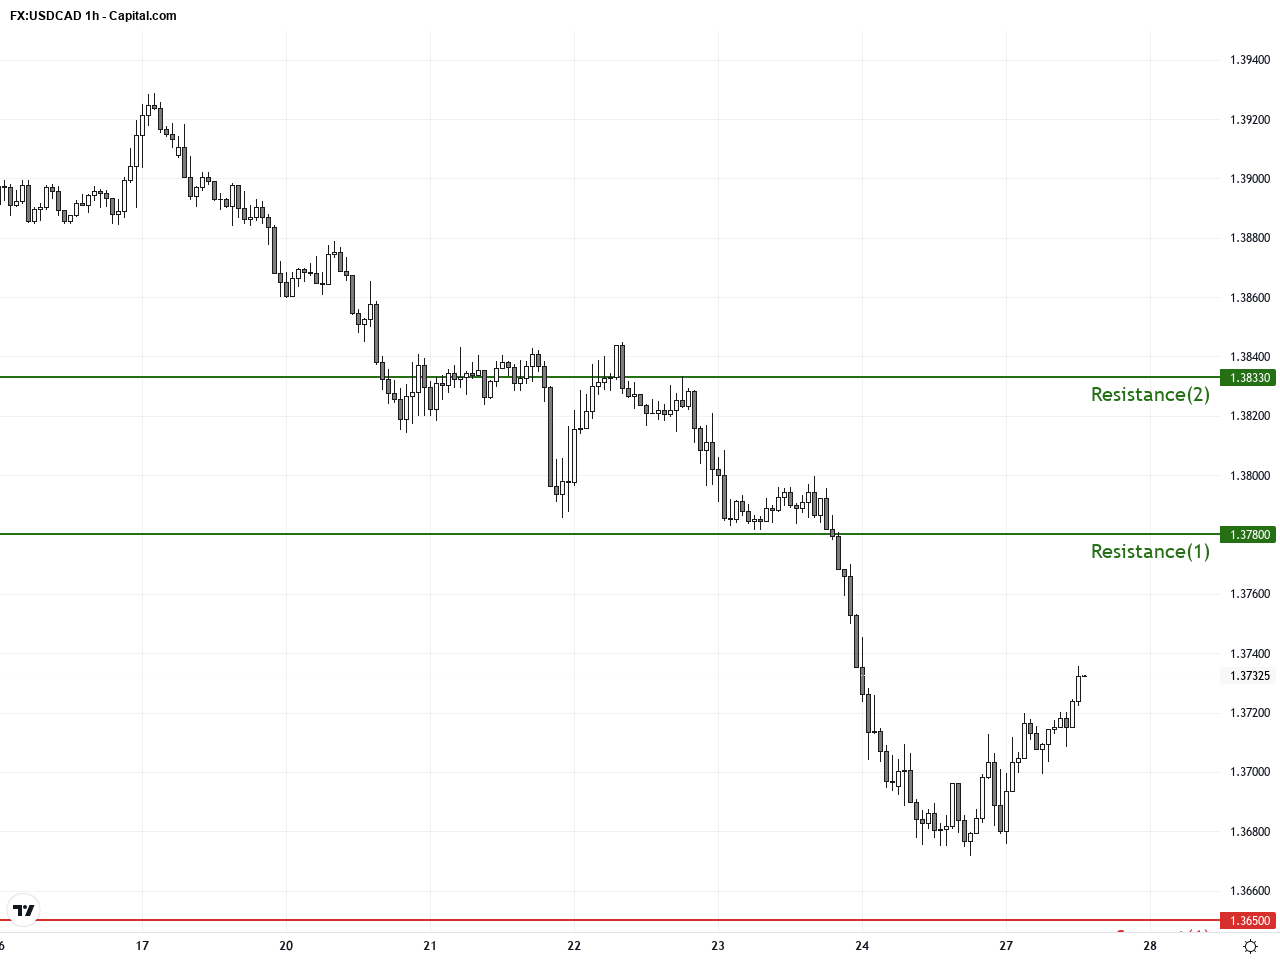
Resistance & Support
The above financial market data, quotes, charts, statistics, exchange rates, news, research, analysis, buy or sell ratings, financial education, and other information are for reference only. Before making any trades based on this information, you should consult independent professional advice to verify pricing data or obtain more detailed market information. 1uptick.com should not be regarded as soliciting any subscriber or visitor to execute any trade. You are solely responsible for all of your own trading decisions.