


 |
| Gold V.1.3.1 signal Telegram Channel (English) |

USDJPY: Double Top Pattern Signals Potential Pullback, Trading Outlook and Key Support Resistance Levels
2026-01-05 @ 11:02
In the past 24 to 48 hours, the USD/JPY pair has maintained a strong upward trend, closing around 157.15, up approximately 0.31% from the previous close near 157.00. The main drivers behind this movement are the renewed global risk-on sentiment combined with rising U.S. bond yields, which continue to support the dollar’s strength. Despite the Bank of Japan’s cautious tightening stance and plans to adjust rates gradually in the second half of 2026, the yield differential remains favorable to the dollar against the yen.
Recent news highlights that the yen weakened against most G-10 currencies amid risk-on sentiment. Supported by resilient U.S. economic growth and expectations of a potential slowdown or early shift to rate cuts by the Federal Reserve, the dollar retains its momentum. This caused the USD/JPY to advance for the fourth consecutive day during the Asian trading session, approaching the key 157 level.
For the average investor, this rise in the dollar against the yen can be seen as markets betting on continued U.S. economic strength, making dollar-denominated assets more attractive due to higher yields, while the yen bears pressure. This trend is likely to persist, especially with the Bank of Japan maintaining loose monetary policy and U.S. yields remaining elevated.
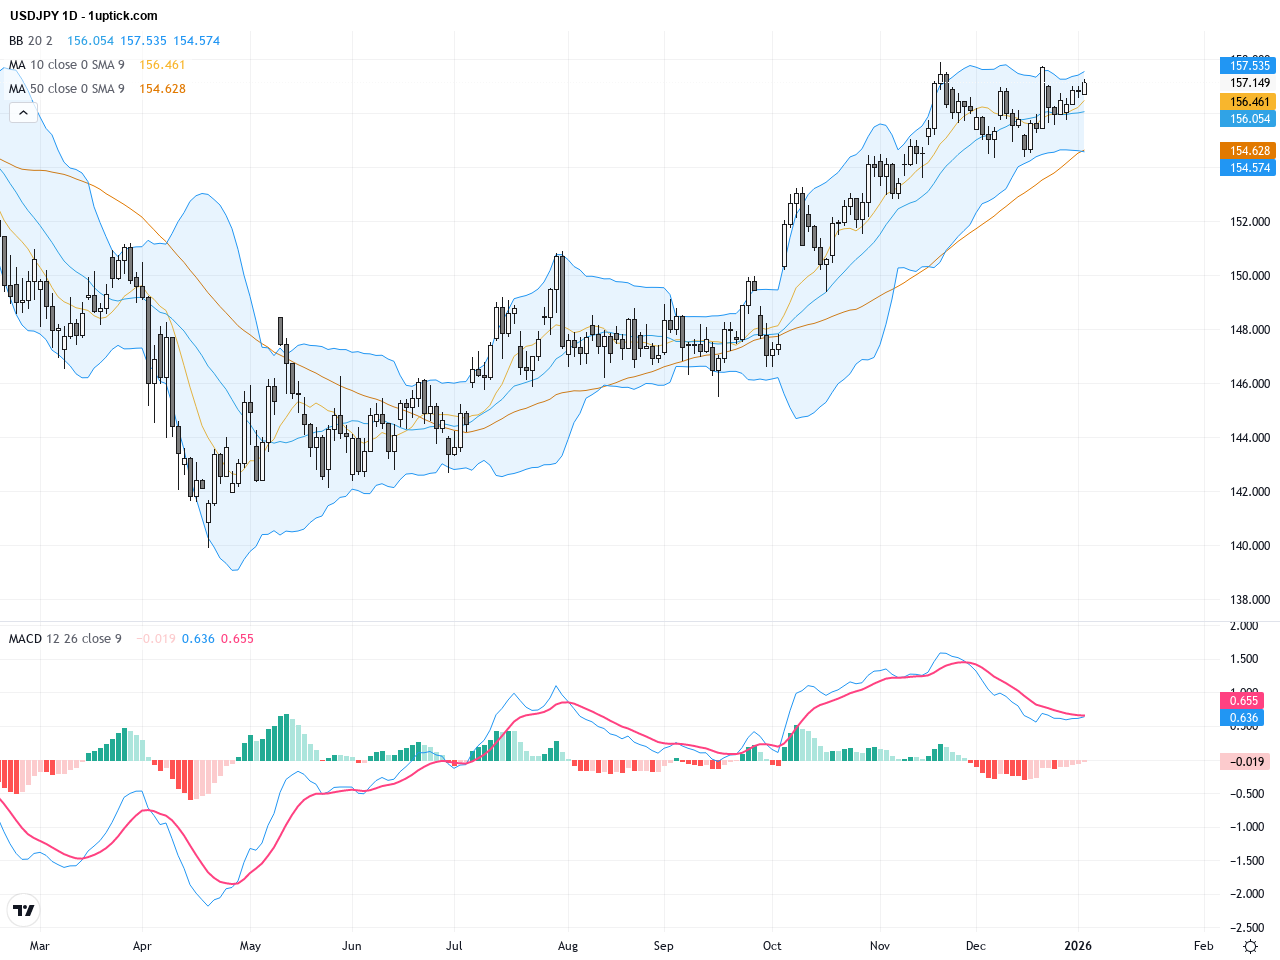
The daily chart shows a steady uptrend since late last year, with the price consistently trading above the 50-day and 200-day moving averages, confirming bullish momentum. Bollinger Bands are widening, indicating increased volatility, though the price is nearing the upper band, suggesting overbought conditions. The MACD remains positive with a rising trend but momentum is slowing, hinting at a potential waning of bullish strength. Overall, the trend remains bullish but watch for possible reversal signals in the technical setup.
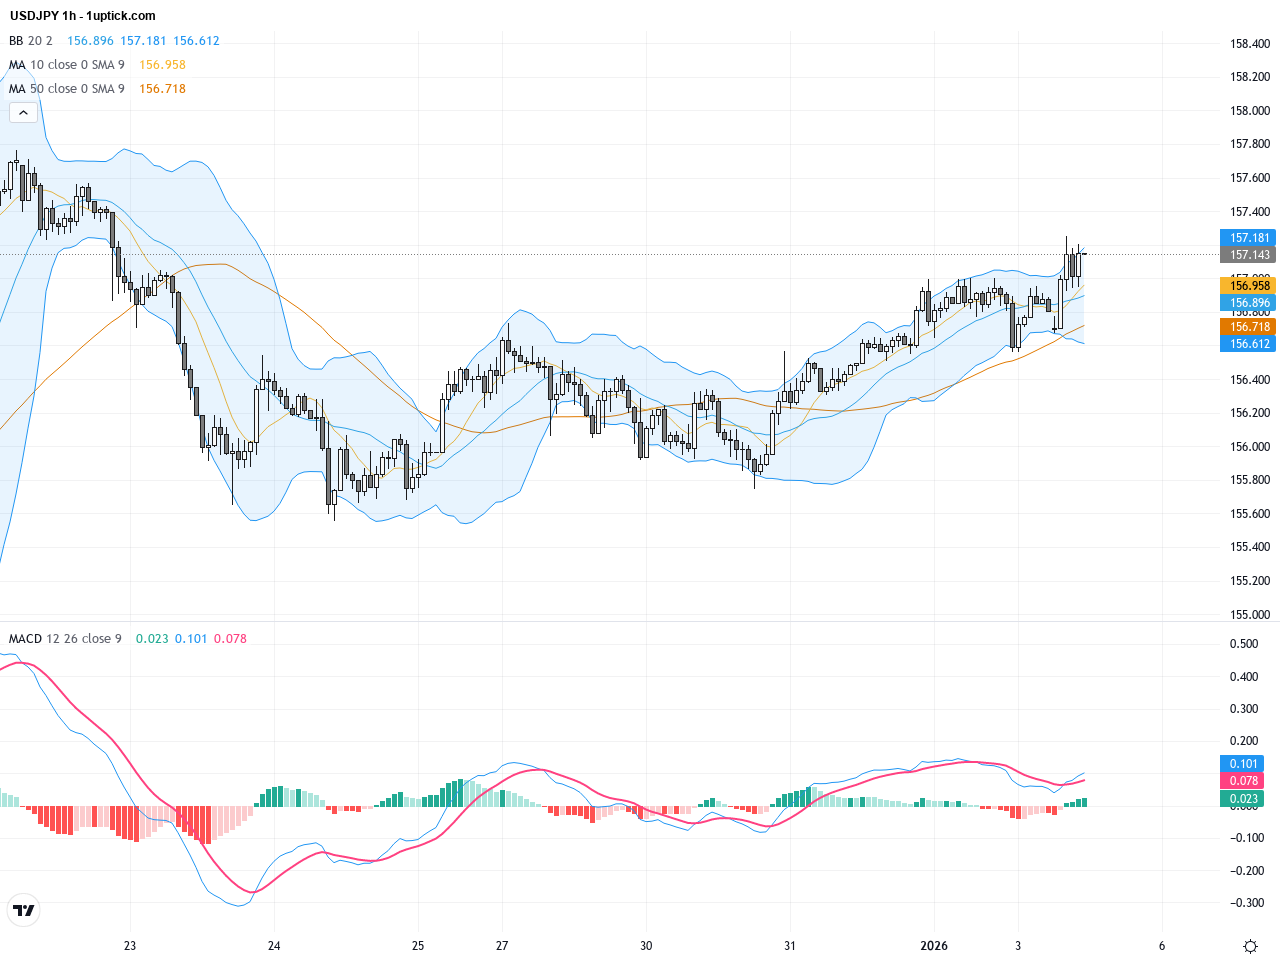
The hourly chart for the past 3 to 5 days reveals tight trading between 156.50 and 157.80, forming an emerging double top structure. Short-term moving averages (5EMA and 20EMA) show frequent crossovers, reflecting short-term tug-of-war between bulls and bears. MACD shows a mild bullish crossover but with insufficient volume, and RSI hovers near 70, indicating overbought conditions. Price action is tending toward sideways consolidation, with a break below support potentially triggering a short-term correction.
Technical Trend: USDJPY is currently in a cautiously bullish trend but facing short-term technical resistance and is likely in a volatile sideways consolidation phase.
The forming double top pattern is an important warning signal for traders, suggesting a potential trend reversal in the short term. Daily MACD momentum is weakening while hourly charts show overbought RSI levels, indicating a possible corrective phase ahead. If price fails to break through key resistance, a pullback or consolidation is likely. Strong US economic data could bolster the USDJPY by widening yield spreads and supporting the dollar, while weak data could increase volatility and downside risk.Today’s economic calendar features Japan’s December Manufacturing PMI at 50, beating the forecast of 49.7, suggesting a slight improvement in manufacturing activity which provides mild support for the yen. However, the impact on USDJPY is limited as market participants focus on upcoming US ISM manufacturing data due later today at 16:00 GMT+1 (midnight HKT), expected to significantly influence the USD movement and hence USDJPY price action.
Resistance & Support

The above financial market data, quotes, charts, statistics, exchange rates, news, research, analysis, buy or sell ratings, financial education, and other information are for reference only. Before making any trades based on this information, you should consult independent professional advice to verify pricing data or obtain more detailed market information. 1uptick.com should not be regarded as soliciting any subscriber or visitor to execute any trade. You are solely responsible for all of your own trading decisions.