


 |
| Gold V.1.3.1 signal Telegram Channel (English) |
USDJPY Eyes Key Support Amid BoJ Intervention Risks and Technical Patterns
2026-01-19 @ 11:02
Over the past 24 to 48 hours, the USD/JPY exchange rate has experienced notable volatility, dropping from yesterday’s close of 158.087 to around 157.80. The market has been influenced by multiple factors, with the Japanese yen strengthening as the government signals potential intervention in the forex market, creating pressure on the dollar against the yen amidst diverging expectations between the Bank of Japan (BoJ) and the Federal Reserve (Fed).
Specifically, the yen’s appreciation was driven by news such as Japanese Finance Minister Satsuki Katayama indicating that Tokyo will not rule out currency intervention, increasing safe-haven demand for the yen. This development contrasts with BoJ’s possible rate hike outlook amid Japan’s fiscal and political uncertainties, while the Fed maintains a hawkish stance, putting pressure on the USD. Due to cautious market sentiment, USD/JPY found resistance near 157.80, showing that while investors remain active, there is concern over policy-driven yen appreciation limiting further dollar gains.
For the average investor, this means that short-term currency markets remain unpredictable, particularly regarding the yen. If you hold or monitor yen-related assets, be aware of possible policy interventions from Japan, which can cause sudden currency fluctuations. For traders, understanding the dynamic between Japanese and US monetary policies remains critical, as differences there often drive USD/JPY price movements.

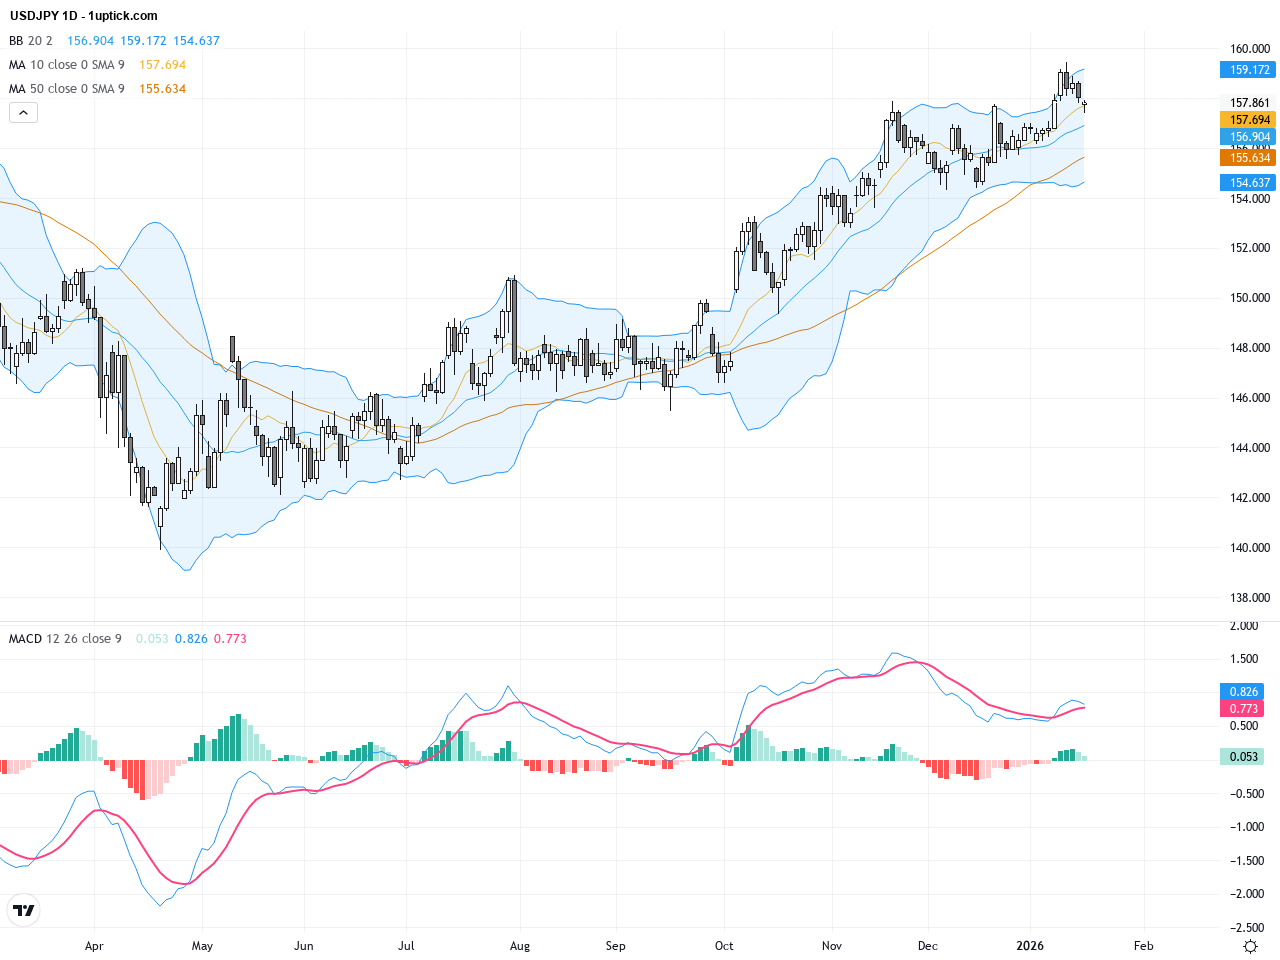
The daily chart displays USDJPY in a strong uptrend over the longer term, rising from approximately 149 since the start of the year. Recently, the pair faces resistance around 158 to 159. Price remains above both the 50-day and 200-day moving averages, indicating a bullish bias. Bollinger Bands are widening, signaling increased volatility, while MACD shows oscillation at elevated levels, suggesting that bullish momentum remains but is weakening, pointing toward a potential consolidation or pullback in the near term.
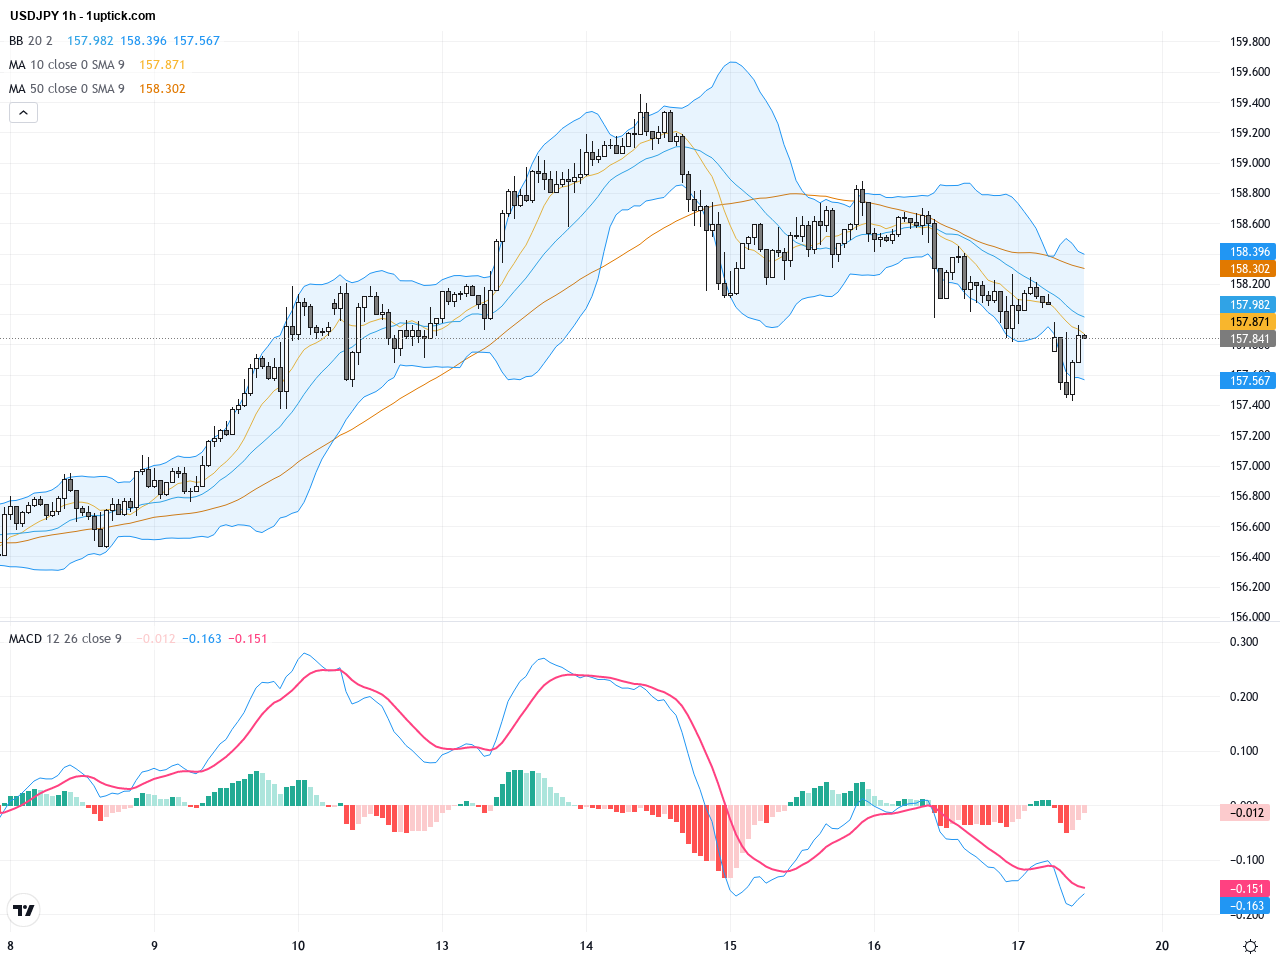
Hourly analysis reveals USDJPY consolidating within a triangle formation over the past 3-5 days, between 157.5 and 159. The pattern began forming around January 15. Price has tested the lower support near 157.80 multiple times, with several bullish hammer candlesticks signaling buying support. However, the MACD on the hourly chart shows a bearish crossover and the RSI is declining slightly, indicating short-term momentum softening and potential for near-term corrective moves.
Technical Trend: The current USDJPY trend is cautiously sideways with bearish undertones.
Technically, USDJPY is sitting at critical support levels on both daily and hourly charts. The longer-term uptrend remains intact, but momentum is fading. The triangle consolidation pattern, if broken downward, could trigger a sharp sell-off. Recent bearish engulfing and multiple low-hammer candlesticks signal potential volatility ahead. Market participants should remain cautious of non-technical risks such as possible BoJ intervention or political developments, emphasizing the need for prudent risk management.Today’s economic calendar points to Japan’s November machinery orders released at around 00:50 GMT+1, showing a sharp 11% month-over-month decline, significantly below expectations of -5.2%. This suggests industrial activity weakness, boosting yen’s safe-haven appeal. Additional Chinese economic data releases indicate slower economic growth, further supporting risk-off sentiment. There are no other direct impactful releases related to USDJPY. These factors may pressure USDJPY downward as traders seek safety in the yen.
Resistance & Support

The above financial market data, quotes, charts, statistics, exchange rates, news, research, analysis, buy or sell ratings, financial education, and other information are for reference only. Before making any trades based on this information, you should consult independent professional advice to verify pricing data or obtain more detailed market information. 1uptick.com should not be regarded as soliciting any subscriber or visitor to execute any trade. You are solely responsible for all of your own trading decisions.
Latest Technical Analysis
Latest Insightz