


 |
| Gold V.1.3.1 signal Telegram Channel (English) |
USDJPY Technical Analysis: Resistance Near 159 Intensifies Amid BOJ Intervention Speculation
2026-01-14 @ 11:01
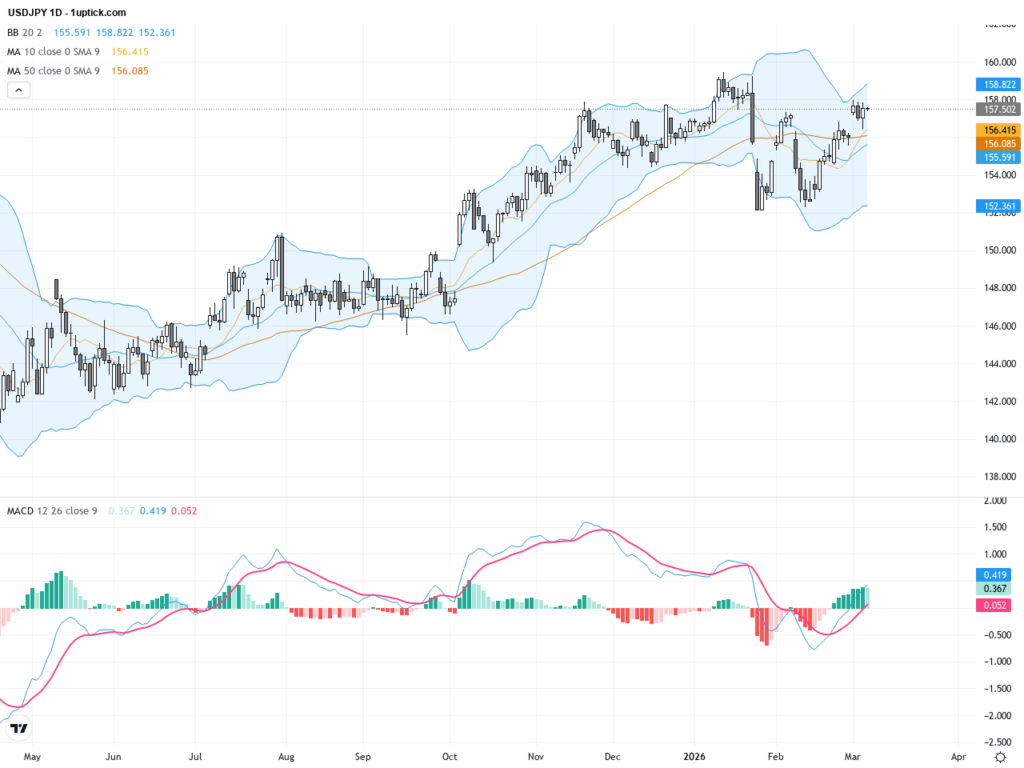
Over the past 24 to 48 hours, the USD/JPY has held steady near 159.2, slightly above yesterday’s closing price of 159.13. Market volatility has been driven primarily by political and fiscal uncertainties in Japan, alongside renewed speculation of yen intervention, which has pressured the yen and favored the dollar’s appreciation.
Recent news headlines have centered around Japan’s internal political shifts and monetary policy contradictions. Concerns over Prime Minister Sanae Takaichi’s potential snap election, combined with plans for enhanced fiscal stimulus pushing Japanese government bond yields higher, have further weakened the yen. This has intensified speculation about whether the Bank of Japan (BOJ) will intervene in the forex market, especially as USD/JPY inches toward its highest level since July 2024, crossing the 159 threshold, spotlighting Japan’s policy paradox.
For the average investor, this scenario is akin to a company facing internal managerial uncertainty with mixed financial reports, creating heightened stock or currency fluctuations. Meanwhile, the dollar is benefiting from safe-haven demand and a hawkish Fed stance, driving noticeable rebounds. In summary, Japan’s political risks and fiscal anxieties have fueled sustained yen weakness and pushed USD/JPY above 159. Investors should closely watch upcoming policy decisions and election developments for continued market impact.

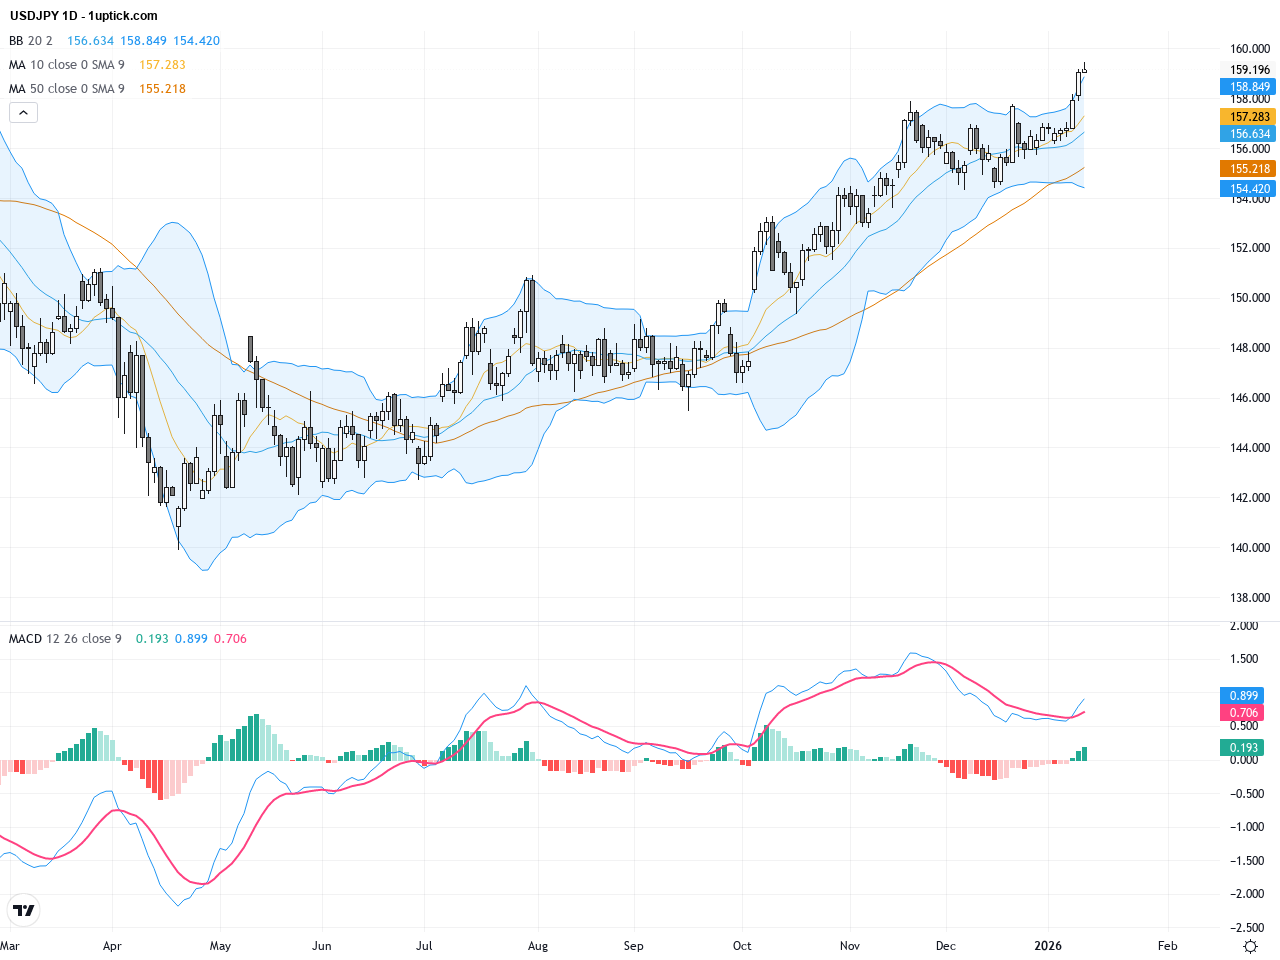
The daily chart reveals a strong bullish trend for USDJPY, with price clearly above the 50-day and 200-day moving averages, confirming sustained upward momentum. The Bollinger Bands have widened, indicating increased volatility. MACD is positive with the fast line comfortably above the slow line and above zero, reinforcing the bullish trend. Price action shows resistance forming near 159, producing some short-term consolidation that traders should watch closely for a breakout or pullback.

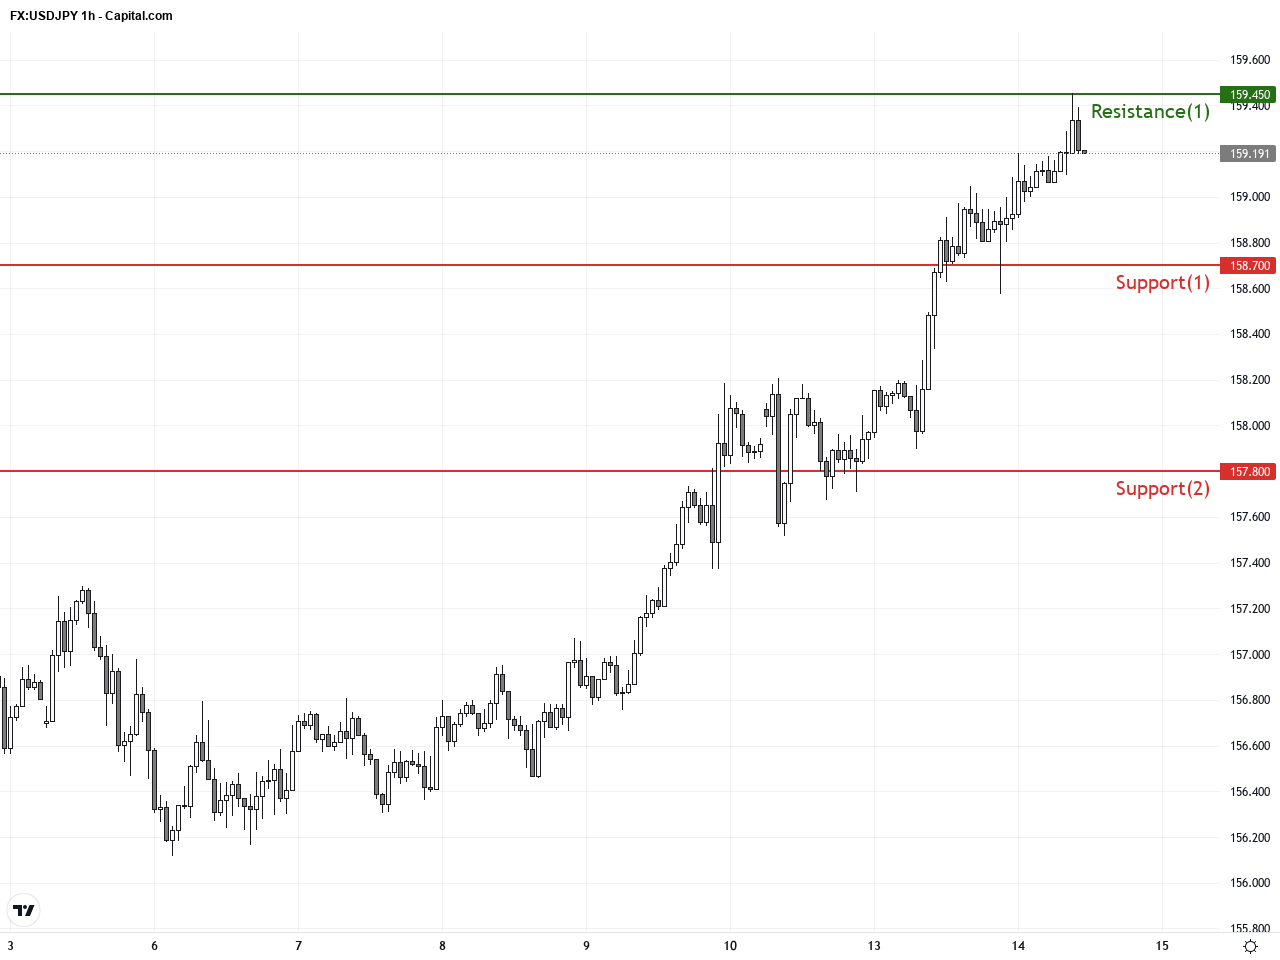
The hourly chart over the past 3-5 days shows USDJPY consolidating near the upper Bollinger Band with bullish moving average alignment. The MACD suggests a mild corrective phase but remains in positive territory. A recent Morning Star candlestick pattern signals a potential short-term bullish reversal. Key intraday levels around 158.70 (support) and 159.45 (resistance) will be critical for steering the next moves.
Technical Trend: Strong and steady uptrend (confidently bullish)
Technically, USDJPY shows robust bullish signals with ongoing MACD bullish crossover and expansion in Bollinger Bands indicating higher volatility. The daily chart confirms strong momentum, while the hourly chart’s Morning Star pattern supports short-term upside potential. However, notable resistance at 159.45 could act as a hurdle before advancing toward the 160 psychological level. Traders should remain cautious of potential BOJ intervention and implement appropriate risk controls.Today’s economic calendar offers limited direct catalysts for USDJPY. Important data from China regarding trade will be released early in the European session, but the overall market focus remains on Japan’s domestic political and fiscal developments, which have a more pronounced effect on yen weakness. No major direct US or Japanese economic releases are scheduled today that could significantly alter USDJPY’s current trajectory.
Resistance & Support
The above financial market data, quotes, charts, statistics, exchange rates, news, research, analysis, buy or sell ratings, financial education, and other information are for reference only. Before making any trades based on this information, you should consult independent professional advice to verify pricing data or obtain more detailed market information. 1uptick.com should not be regarded as soliciting any subscriber or visitor to execute any trade. You are solely responsible for all of your own trading decisions.