


 |
| Gold V.1.3.1 signal Telegram Channel (English) |

USDJPY Technical & Fundamental Analysis: Breaking Above 156.50 with Double-Top Warning for a Pullback
2026-01-02 @ 08:01
Over the past 24 to 48 hours, the USD/JPY pair has shown steady upward momentum, climbing from yesterday’s closing price near 156.72 to nearly 156.75. This movement was largely driven by the Bank of Japan’s (BoJ) cautious tightening stance, which weakened the Japanese Yen. Market participants digested the BoJ’s conservative approach to monetary policy, resulting in persistent Yen softness and supporting the US Dollar’s strength.
Additionally, the US Dollar Index (DXY) remained firm during year-end trading, boosting the Dollar against various currencies and lending strength to USD/JPY. Despite technical forecasts hinting at a possible double-top pattern that could signal a pullback, the pair traded within a narrow range, reflecting investor caution regarding the timing of further BoJ rate hikes and future policy direction.
For the average investor, this USD/JPY movement illustrates the direct impact of diverging central bank policies: when the domestic central bank maintains a cautious stance while external monetary policy tightens, currency pairs tend to experience notable value shifts. Simply put, this is a currency adjustment based on policy expectations, reminding investors to manage cross-border investment and forex risks prudently. Even when the overall market appears stable, underlying policy uncertainties can trigger sudden volatility.
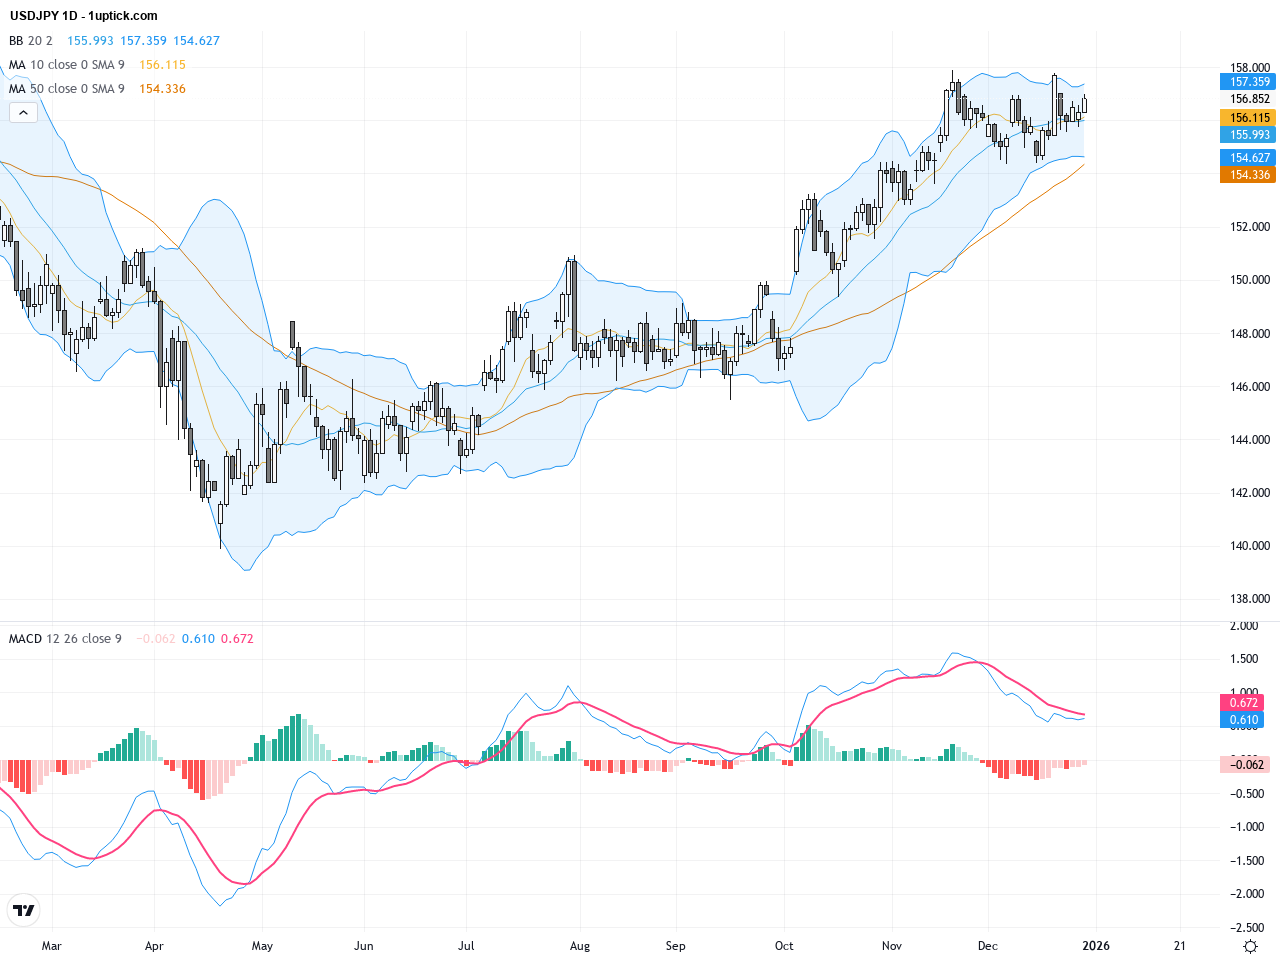
The daily chart shows a clear uptrend in USDJPY, with prices steadily climbing since the start of the year, surpassing the 155 to 156 range. The Bollinger Bands are widening upward, indicating increased volatility, with the price oscillating near the middle and upper bands. The 50-day moving average sits near 155 and is trending upwards, while the 200-day moving average remains significantly lower, confirming a strong long-term uptrend. The MACD remains in positive territory, signaling strong bullish momentum. However, the recent formation of a double-top pattern suggests short-term resistance and a possible correction.
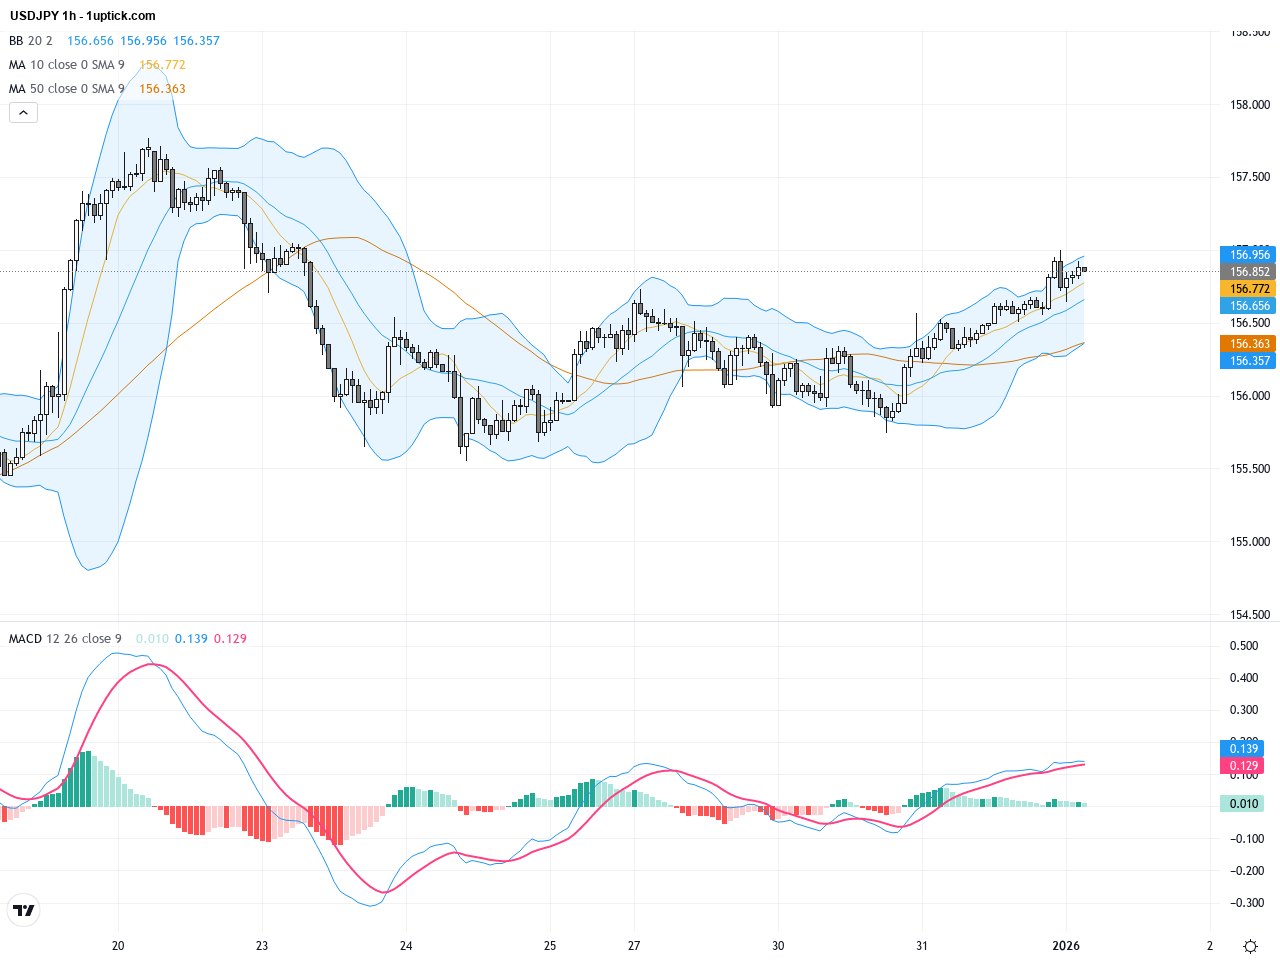
The hourly chart over the past 3-5 days shows USDJPY trading in a narrow range between 156.30 and 156.80, forming a tight consolidation zone. The price is near the upper boundary of an ascending channel, and Bollinger Bands are contracting, suggesting reduced short-term volatility. Short-term moving averages (20 and 50) are converging, and the MACD shows a slight bearish crossover, indicating weakening short-term bullish momentum. The recent bearish engulfing candlestick strengthens the case for a potential short-term pullback, so traders should closely watch for breakout or breakdown confirmations.
Technical Trend: The current trend direction is cautiously sideways within a strong bullish framework, reflecting consolidation and pullback signals. Traders are advised to weigh risks carefully before making decisions.
USDJPY has confidently broken above the 156.50 level but is forming a classic double-top pattern, a potential reversal sign that warns of a price pullback. The recent bearish engulfing candlestick adds to selling pressure, and the MACD bearish crossover confirms weakening momentum. Nevertheless, the long-term bullish trend remains intact. Traders should monitor key support levels closely to avoid premature entries into potential retracements.There are no significant or directly relevant economic events scheduled today (GMT+1) that would impact USDJPY. Thus, technical factors and market sentiment will largely drive price movements in the short term.
Resistance & Support

The above financial market data, quotes, charts, statistics, exchange rates, news, research, analysis, buy or sell ratings, financial education, and other information are for reference only. Before making any trades based on this information, you should consult independent professional advice to verify pricing data or obtain more detailed market information. 1uptick.com should not be regarded as soliciting any subscriber or visitor to execute any trade. You are solely responsible for all of your own trading decisions.