

 |
| Gold V.1.3.1 signal Telegram Channel (English) |

USDJPY: Triangle Pattern Emerges Amid Japan’s Snap Election Uncertainty – Trading Outlook & Key Support Resistance
2026-01-21 @ 11:01
Over the past 24 to 48 hours, the USD/JPY pair showed notable volatility, closing around 157.91, slightly down from yesterday’s 158.14 close. The recent movement has been largely driven by political uncertainty ahead of Japan’s snap election and rising Japanese Government Bond (JGB) yields. Expectations of a potential Bank of Japan rate hike also supported the Japanese yen, while US tariff threats from President Trump limited further dollar strength.
This market action is akin to investors holding back ahead of a critical election, waiting for clearer policy direction. The dual uncertainty from political risks and economic policy kept the USD/JPY oscillating near the 158 level with occasional swings, reflecting a cautious stance among market participants. In summary, the recent USD/JPY price adjustments capture the intertwined effects of Japan’s domestic political developments and US trade policy tensions, making it a key focus for investors.

The daily chart shows a strong uptrend in USDJPY since the start of the year, with price consistently above the 50-day (blue) and 200-day (orange) moving averages, signaling bullish momentum. Bollinger Bands are widening, indicating rising volatility. The MACD is above the zero line but shows a shrinking histogram, suggesting a slowdown in upward momentum. Recently, a symmetrical triangle pattern has been forming since mid-January, indicating market indecision and an imminent breakout. A close above the triangle’s upper boundary would signal a bullish continuation targeting recent highs around 159.4, while a breakdown below might trigger a short-term correction.

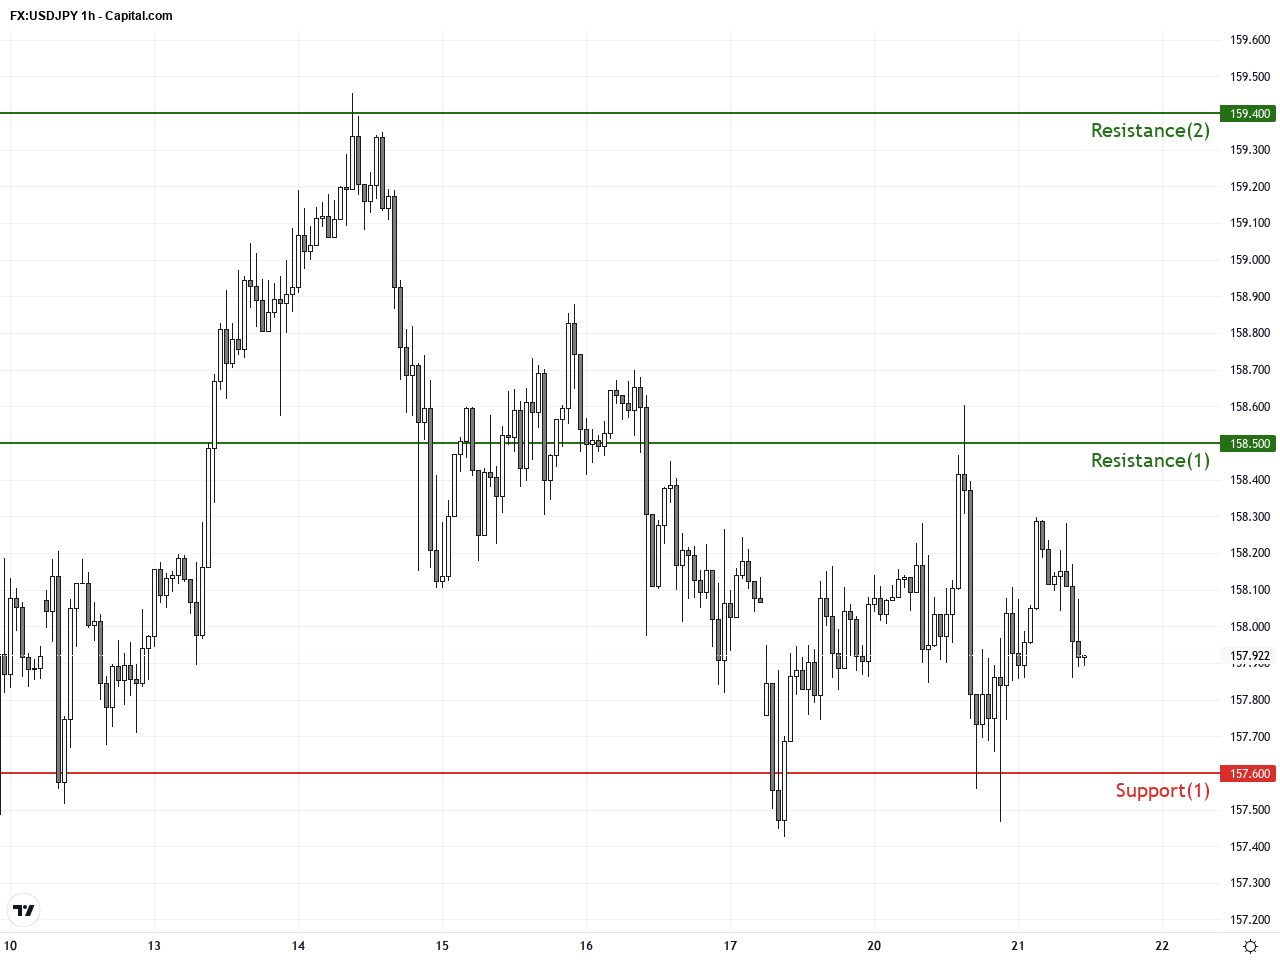
On the hourly chart covering the past 3-5 days, USDJPY has traded in a tight range between 157.85 and 158.28, showing short-term sideways consolidation. Price has found repeated support at the 50-hour moving average, and Bollinger Bands are narrowing, indicating diminishing momentum. The MACD has recently crossed bearish, signaling potential short-term downside. Additionally, a bearish engulfing candlestick emerged, implying sellers are gaining control in the next 24-hour window, though the overall outlook remains supported by fundamental factors.
Technical Trend: Cautiously consolidating, awaiting breakout signals
Technically, USDJPY is navigating a critical symmetrical triangle, awaiting a breakout confirmation. The daily Bollinger Bands expansion indicates potential for increased volatility, while the contracting MACD warns of a momentum slowdown. Short-term bearish engulfing candlestick on the hourly chart hints at selling pressure but doesn’t negate the overall uptrend. Key triggers will be a breakout above 158.30-158.50 or a breakdown below 157.60 to define the next directional move.Today’s economic calendar does not feature any major events directly impacting USDJPY. While UK CPI and US construction spending data are released, their immediate effects on the yen or dollar are limited. Traders should focus on upcoming developments in Japan’s political landscape and US-Europe trade relations for guidance.
Resistance & Support
The above financial market data, quotes, charts, statistics, exchange rates, news, research, analysis, buy or sell ratings, financial education, and other information are for reference only. Before making any trades based on this information, you should consult independent professional advice to verify pricing data or obtain more detailed market information. 1uptick.com should not be regarded as soliciting any subscriber or visitor to execute any trade. You are solely responsible for all of your own trading decisions.