


 |
| Gold V.1.3.1 signal Telegram Channel (English) |

WTI Crude Oil: Price Stabilizes with Key Support and Resistance Levels to Watch
2026-01-02 @ 15:58
Over the past 24 to 48 hours, WTI crude oil prices showed a slight upward trend, closing at $57.89 per barrel, a modest increase from the previous trading day. In 2025, oil prices experienced the biggest annual loss since 2020, mainly driven by an oversupply situation and the unwinding of production cuts. Recent market news highlighted that Ukrainian drone attacks on Russian energy facilities and U.S. sanctions on Venezuelan exports have contributed to a recent boost in oil price resilience.
Starting 2026, oil prices began with a slight uptick, but the market still faces a persistent supply-demand imbalance. Many analysts project oil prices to range between $55 and $65 per barrel in Q1 of 2026. OPEC+ production policies and geopolitical risks remain key focus areas for the market. For the average investor, this scenario suggests that while oil prices may have bottomed and could rebound in the near term, uncertainties remain due to potential policy shifts and global supply-chain disruptions, warranting close monitoring of relevant market news impacting prices.
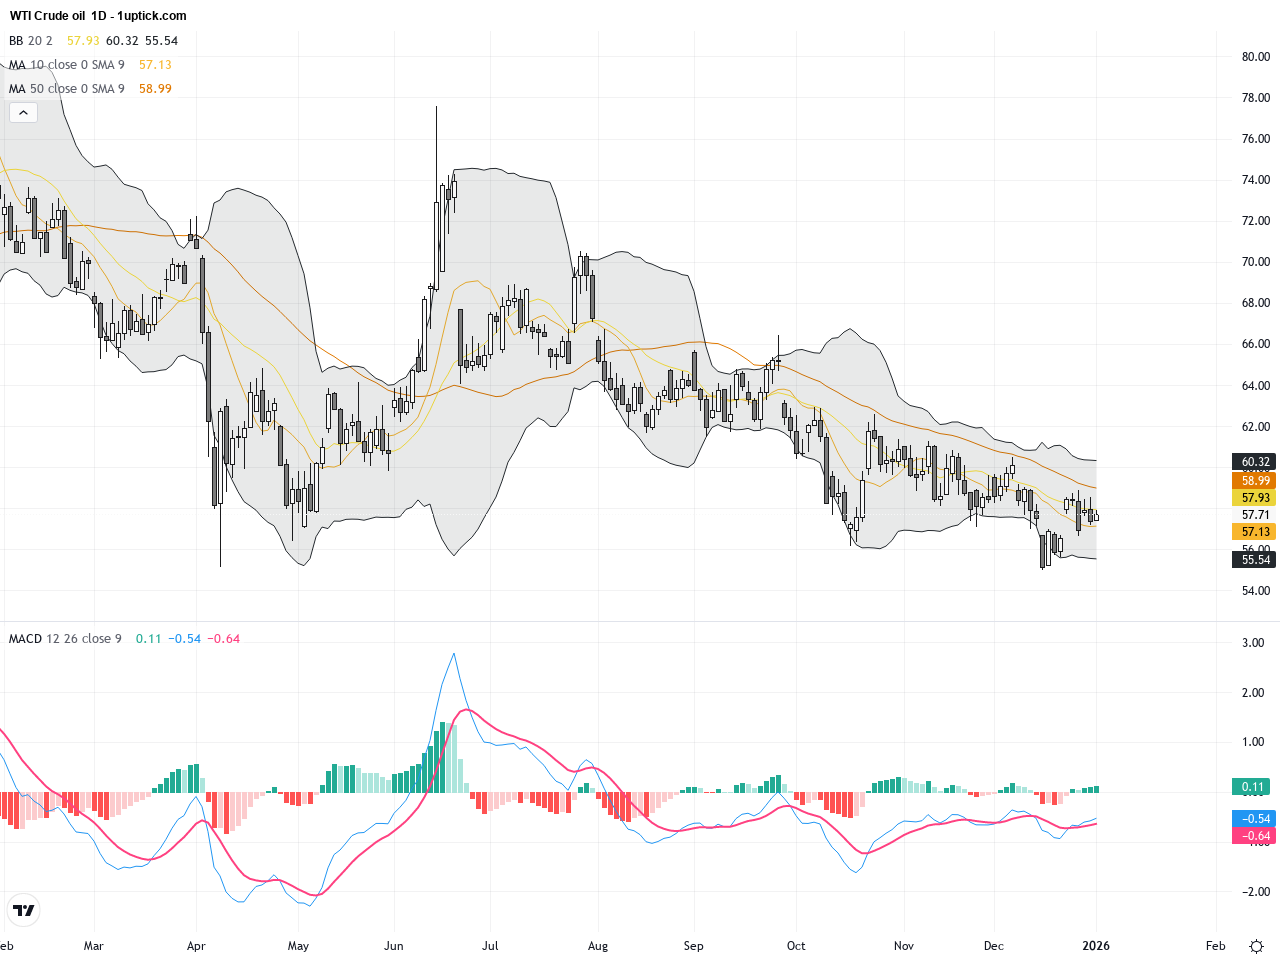
The daily chart of WTI crude oil shows a post-downtrend consolidation phase, trading mostly between $57.20 and $58.50 since late 2025. Prices hover near the middle Bollinger Band, indicating a neutral zone. The 20-day and 50-day Moving Averages show a slight downward bias, but prices are nearing the crucial 50-day MA resistance point. The MACD histogram is contracting, with the signal and MACD lines converging, suggesting decreasing bearish momentum and a potential trend reversal or sideways movement ahead.
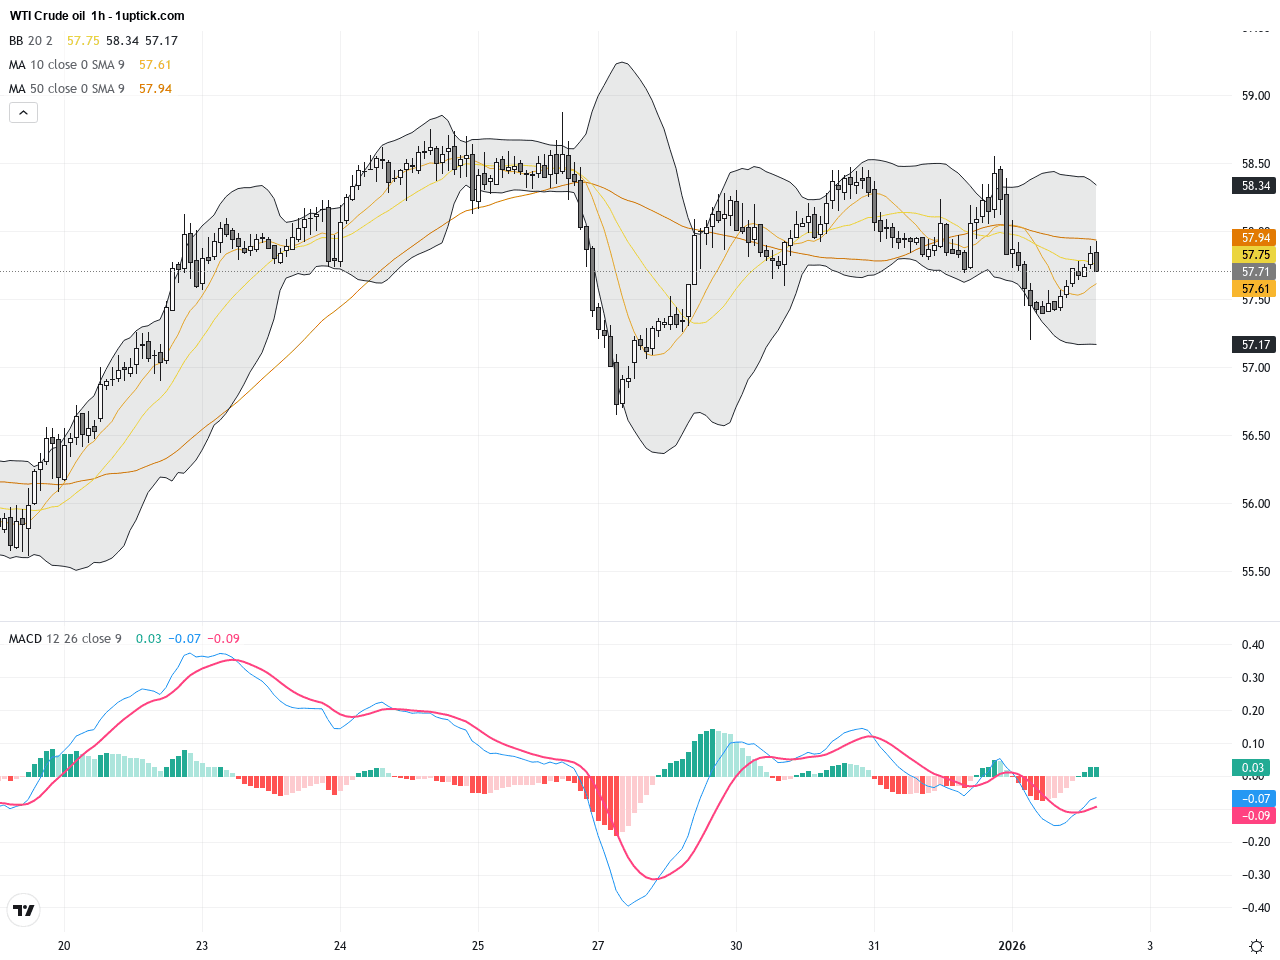
On the hourly chart over the last five trading days, WTI crude demonstrates a clear short-term uptrend, moving from lows near $57.20 up to $57.89. Prices frequently touch the middle Bollinger Band and occasionally test the upper band, reflecting strengthening short-term bullish momentum. The MACD shows a bullish crossover above the zero line, supported by healthy volume. This technical setup signals a probable continuation of upward momentum in the next 24 to 72 hours.
Technical Trend: WTI crude currently exhibits a cautiously consolidating trend with short-term bullish bias, while medium to long-term trend confirmation requires resistance breakout.
The key technical insight for WTI crude oil lies in whether prices can firmly break above the 50-day moving average, a pivotal resistance level indicating a potential trend shift. Increasing volume and the MACD bullish crossover point to strengthened short-term momentum. Additionally, the recent bullish engulfing candlestick suggests that upward momentum may persist over the next 24 hours. Traders should remain cautious of possible pullbacks near resistance levels.There are no significant direct economic events today expected to impact WTI crude oil prices. However, markets remain attentive to the upcoming OPEC+ meeting and ongoing geopolitical developments, which are critical to supply-demand expectations and could provoke notable price movements.
Resistance & Support

The above financial market data, quotes, charts, statistics, exchange rates, news, research, analysis, buy or sell ratings, financial education, and other information are for reference only. Before making any trades based on this information, you should consult independent professional advice to verify pricing data or obtain more detailed market information. 1uptick.com should not be regarded as soliciting any subscriber or visitor to execute any trade. You are solely responsible for all of your own trading decisions.