


 |
| Gold V.1.3.1 signal Telegram Channel (English) |

XAUUSD: Geopolitical Tensions Propel Gold to Key Resistance Breakout, Trading Outlook Bright
2026-01-06 @ 05:01
Over the past 24 to 48 hours, gold (XAUUSD) has surged significantly, surpassing yesterday’s closing price of $4,444.59 to reach new highs. This rally is primarily driven by the major geopolitical shock of the Venezuelan president being captured by the U.S., which ignited a sharp increase in safe-haven demand.
Additionally, escalating political tensions involving the U.S., Colombia, Mexico, and Greenland have kept the pressure on, pushing gold prices higher as investors flock to this traditional safe haven asset to hedge risks. Silver prices also soared, rising 6%, further underscoring the market’s clear flight to safety. It’s akin to people choosing to secure their valuables during uncertain times—gold emerges as the go-to refuge for capital.
In summary, ongoing geopolitical instability and international friction have fueled bullish momentum in gold, triggering intense buying activity with prices repeatedly hitting record highs, making it a key market focus in this period.

The daily chart reveals a strong bullish trend in XAUUSD, with prices steadily climbing since late December from the 4300 level. The 20-day and 50-day moving averages show a bullish alignment, confirming upward momentum. Bollinger Bands are widening, indicating increased volatility. The MACD has crossed above zero, reinforcing buying sentiment. Overall, the daily technical setup supports continued bullish momentum in gold.
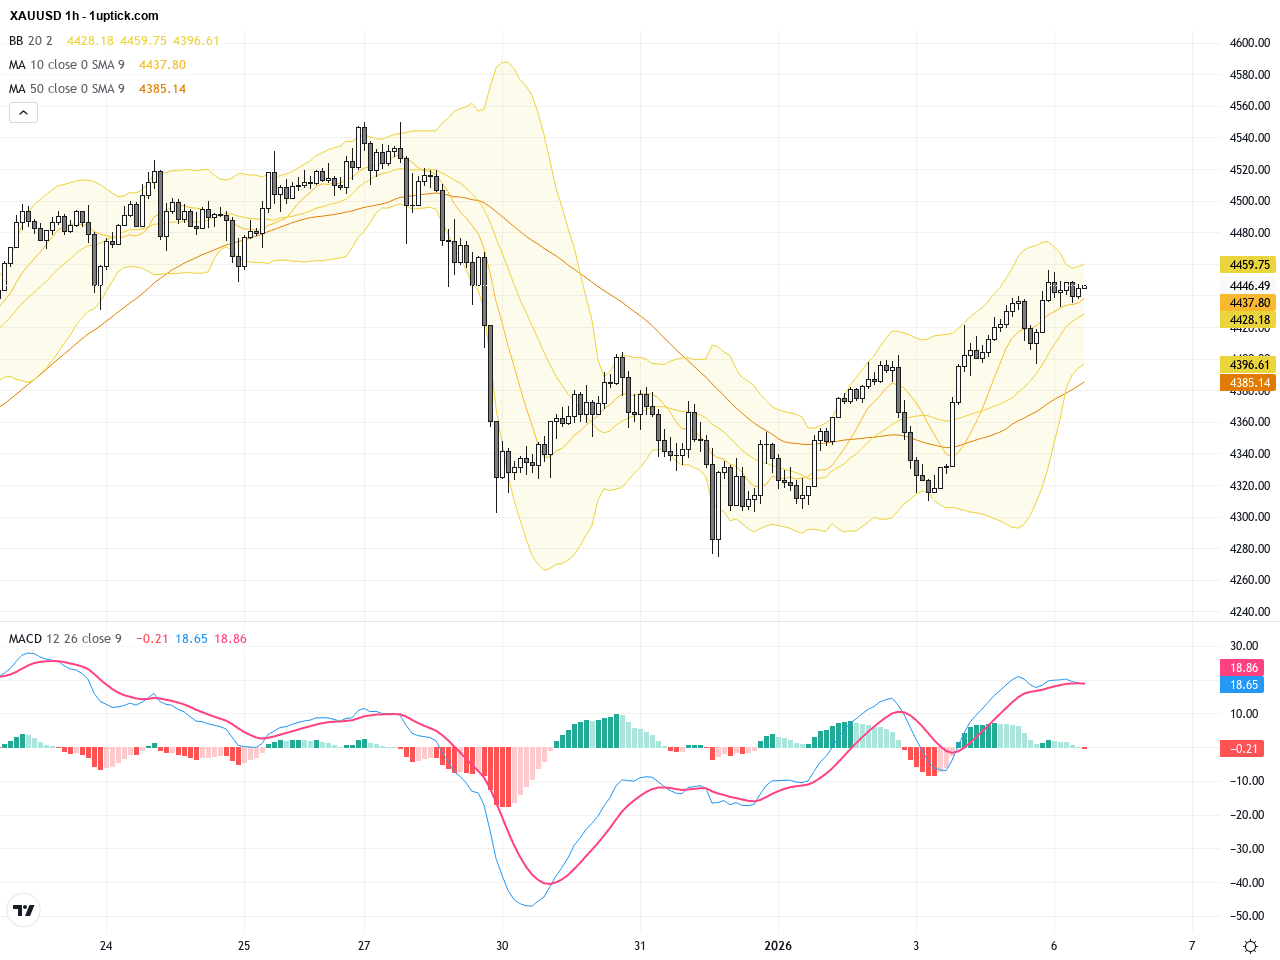
The hourly chart over the past 3-5 days shows a slight short-term consolidation within an overall bullish context. A clear ascending flag pattern has formed, suggesting potential for an upward breakout. Bollinger Bands are tightening, reflecting reduced short-term volatility, while MACD remains positive, indicating sustained upward momentum. The price is holding firmly near a critical support level around 4300, suggesting buyers’ strength and possible rebound opportunities.
Technical Trend: The current trend for XAUUSD is decisively bullish, with clear momentum supporting higher prices.
Key technical insights include a bullish MACD crossover and expanding Bollinger Bands on the daily chart, signaling strong upward momentum. The ascending flag pattern on the hourly chart points to a likely short-term breakout to the upside. Recent bullish engulfing candlesticks indicate strong buyer interest, suggesting that XAUUSD could maintain its upward trajectory over the next 24 hours. The geopolitical risk backdrop further supports this technical bullishness, offering traders a favorable environment for trend-following strategies.Today’s economic calendar highlights US ISM Manufacturing data at 16:00 GMT+1, which is slightly below expectations (47.9 vs 48.3), signaling manufacturing sector slowdown. This could weaken the US dollar and potentially boost gold as a safe haven. Other notable events include Japan’s manufacturing PMI and China’s services PMI; however, these are less likely to directly influence XAUUSD. Overall, the ISM report could increase short-term volatility, especially through USD price action, impacting gold prices accordingly.
Resistance & Support

The above financial market data, quotes, charts, statistics, exchange rates, news, research, analysis, buy or sell ratings, financial education, and other information are for reference only. Before making any trades based on this information, you should consult independent professional advice to verify pricing data or obtain more detailed market information. 1uptick.com should not be regarded as soliciting any subscriber or visitor to execute any trade. You are solely responsible for all of your own trading decisions.