


 |
| Gold V.1.3.1 signal Telegram Channel (English) |

XAUUSD Gold Analysis: Key Support Holds Amid Short-Term Pullback Risks
2026-01-02 @ 15:48
Over the past 24 to 48 hours, gold (XAUUSD) has continued to demonstrate significant volatility. The closing price on January 2 was $4,374.01 per ounce, up from the opening price of $4,349.23 the previous day, indicating sustained buying interest at the start of the new year. Market movements were driven by multiple factors, most notably the surge in demand for physical gold investments, especially with forecasts predicting a sharp increase in gold ETF demand in 2025, as investors remain cautiously optimistic.
Recent news such as “PHYS: It’s Time For Patience” highlighted that Sprott Physical Gold Trust remains a cautious buy, reflecting that despite heightened market enthusiasm, investors are advised to retain patience to withstand potential price corrections. Although gold prices briefly soared past the $4,500 mark earlier in the year, subsequent pullbacks showed profit-taking pressures, with the metal experiencing nearly a 5% single-day decline at times, signaling the risk of a near-term retracement.
Overall, gold’s recent strong performance and record-breaking highs continue to underscore its appeal as a safe-haven asset amid global economic uncertainty and fluctuating US dollar dynamics. For the average investor, this means gold remains a crucial component of a diversified portfolio, but managing risk through patience and strategic holding is key given the short-term price swings.
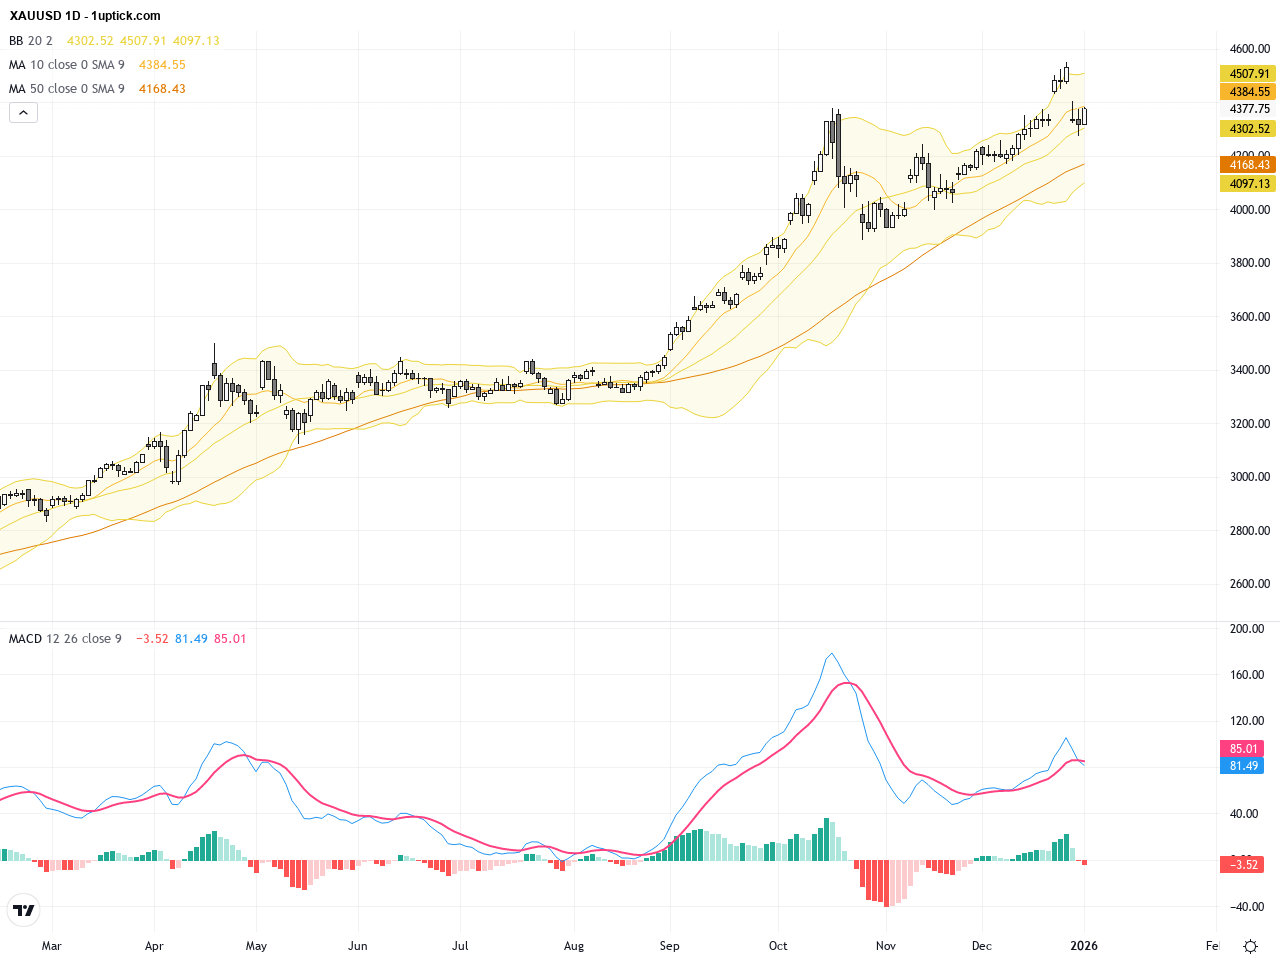
The daily chart shows a steady uptrend starting from mid-December, with prices climbing from around $4,280 to approximately $4,374 today. Technical indicators like the Bollinger Bands are expanding, suggesting increased volatility, while the 20-day moving average is acting as strong support beneath the current price. The MACD remains in bullish territory with expanding histogram bars, confirming sustained upward momentum. However, recent sideways price action near highs signals the need for caution as momentum is yet to fully accelerate.

The hourly chart over the past 3-5 days reveals more noticeable short-term fluctuations. Price is consolidating between $4,341 and $4,381 with short-term moving averages converging, while Bollinger Bands have flattened indicating market indecision. The MACD lines are nearing a crossover, signifying potential momentum changes. A small flag pattern has formed, which if broken to the upside above $4,381, could trigger a strong rally; conversely, a breakdown below $4,340 may increase short-term bearish risks.
Technical Trend: The gold trend is cautiously bullish with volatility in play.
Technically, XAUUSD is at a critical momentum juncture. The daily chart supports a strong bullish backdrop confirmed by MACD, while the hourly chart’s nearing MACD crossover and flag formation suggest potential short-term adjustment or breakout. A recent hammer candlestick pattern signals a possible bottom reversal, adding to bullish probabilities. Traders should watch the $4,381 resistance closely; a break above could prompt further gains, while a breach below $4,340 support may signal accelerating retracement.Today’s GMT+1 economic calendar highlights the US final Manufacturing PMI release at 15:45 as the most relevant event for XAUUSD. Forecasts suggest a slight drop from 52.2 to 51.8, indicating mild cooling. A better-than-expected reading could strengthen the US dollar, putting downward pressure on gold prices, while a weaker outcome might boost gold’s safe-haven appeal. Other data from Europe and Canada are scheduled but are unlikely to significantly impact gold today.
Resistance & Support

The above financial market data, quotes, charts, statistics, exchange rates, news, research, analysis, buy or sell ratings, financial education, and other information are for reference only. Before making any trades based on this information, you should consult independent professional advice to verify pricing data or obtain more detailed market information. 1uptick.com should not be regarded as soliciting any subscriber or visitor to execute any trade. You are solely responsible for all of your own trading decisions.
Latest Technical Analysis
Latest Insightz
