


 |
| Gold V.1.3.1 signal Telegram Channel (English) |
XAUUSD: Gold Continues Bounce with Key Technical Patterns Guiding Short-Term Trading Outlook
2026-01-02 @ 08:01
Over the past 24 to 48 hours, gold (XAUUSD) has remained volatile near its recent highs, closing yesterday at $4,337.48, marking a slight pullback from the previous day. The recent steep rise in gold prices has been driven by multiple factors, with a notable influence from the U.S. Federal Reserve’s policies. Latest market news highlights that despite the risk of technical corrections, gold continues to show strong bullish momentum, supported by surging demand for gold ETFs in 2025. This signals to investors the importance of patience and a cautious buying approach.
Furthermore, robust U.S. GDP data generally supports the U.S. dollar, which can pressure gold prices; however, the recent weakening of the dollar has provided a boost to gold. Investors can interpret the recent price movements as a tug-of-war between economic growth optimism and increased demand for safe-haven assets. For the average investor, this means gold remains a key asset for portfolio diversification amid ongoing economic uncertainty, but they should stay prepared for price fluctuations and short-term pullbacks.

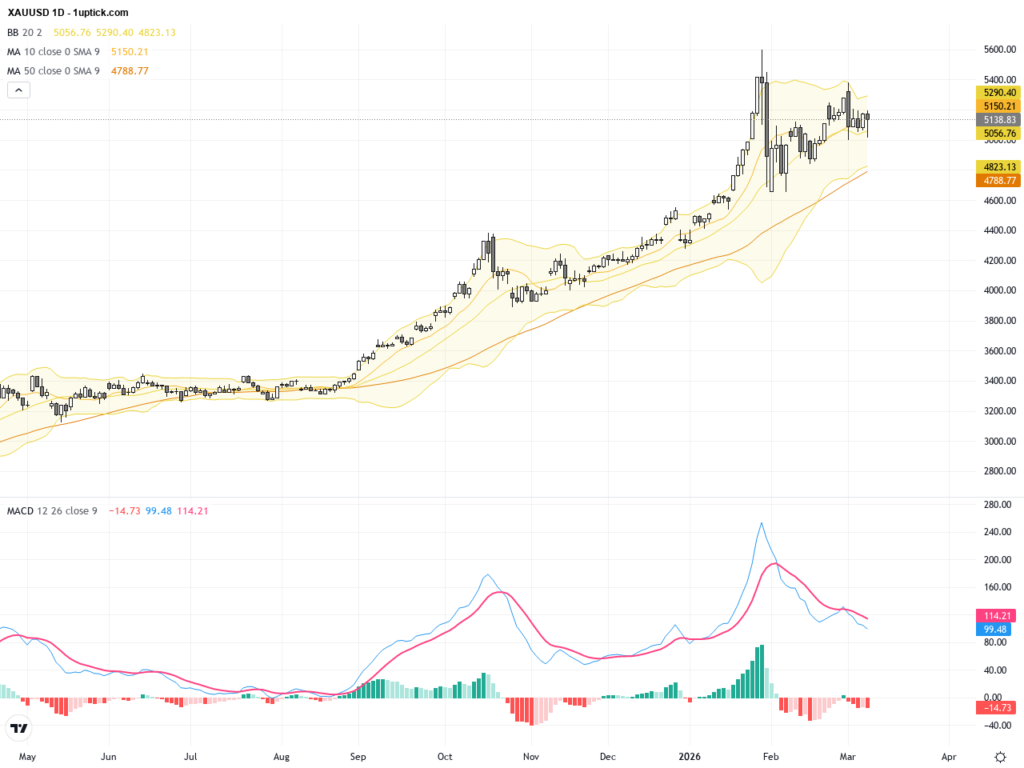
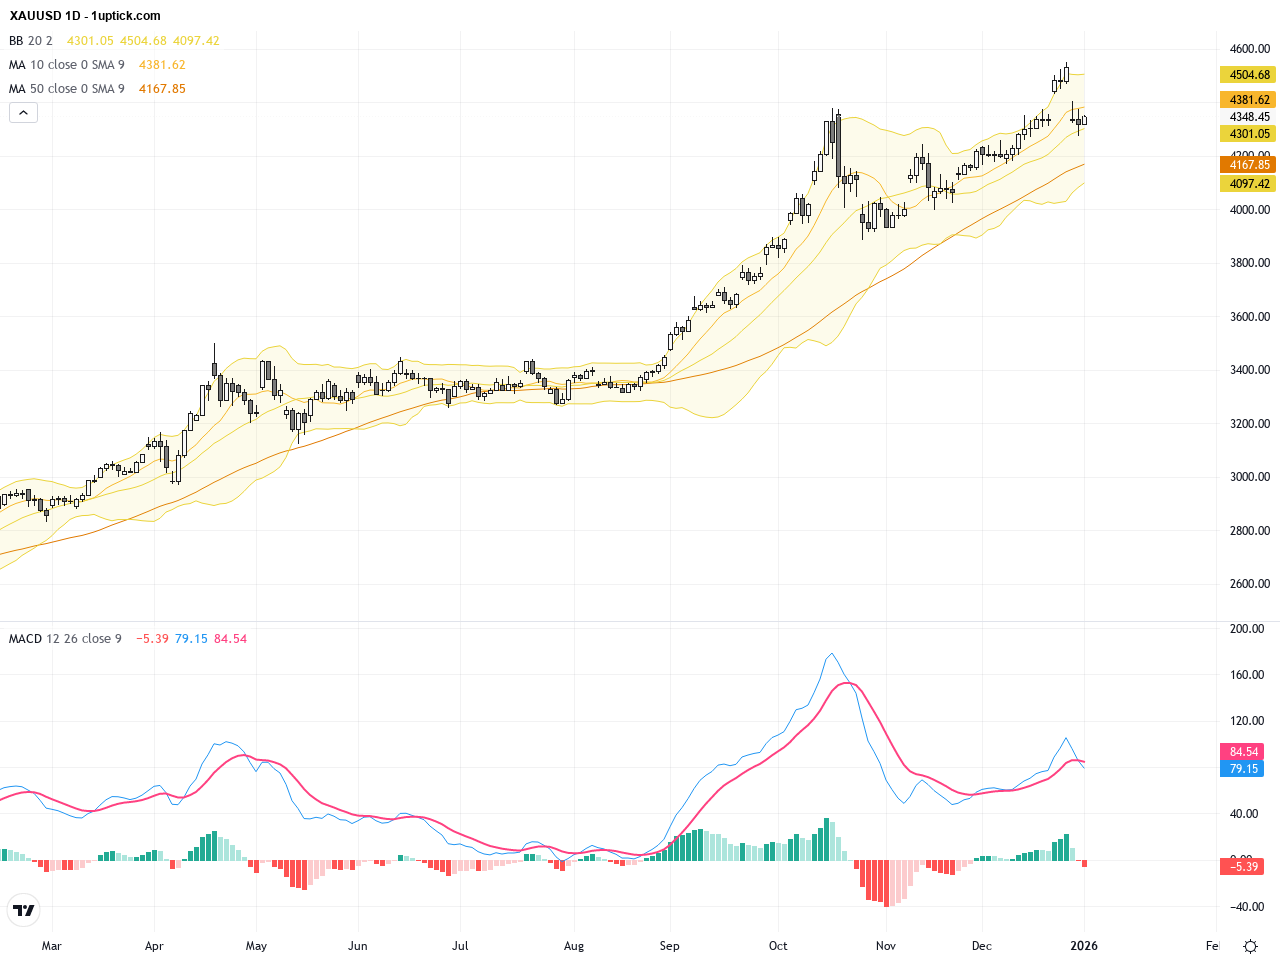
The daily chart reveals that since mid-December, XAUUSD has undergone significant fluctuations with an overall upward trend phase. Recently, the price encountered resistance near the 4350 level, forming a clear consolidation zone. Moving averages are aligned bullishly, and the Bollinger Bands’ midline trends upwards, indicating a longer-term bullish trend. However, the MACD signals waning momentum, suggesting near-term correction risks. Traders should watch key support levels and the possibility of a breakdown carefully.
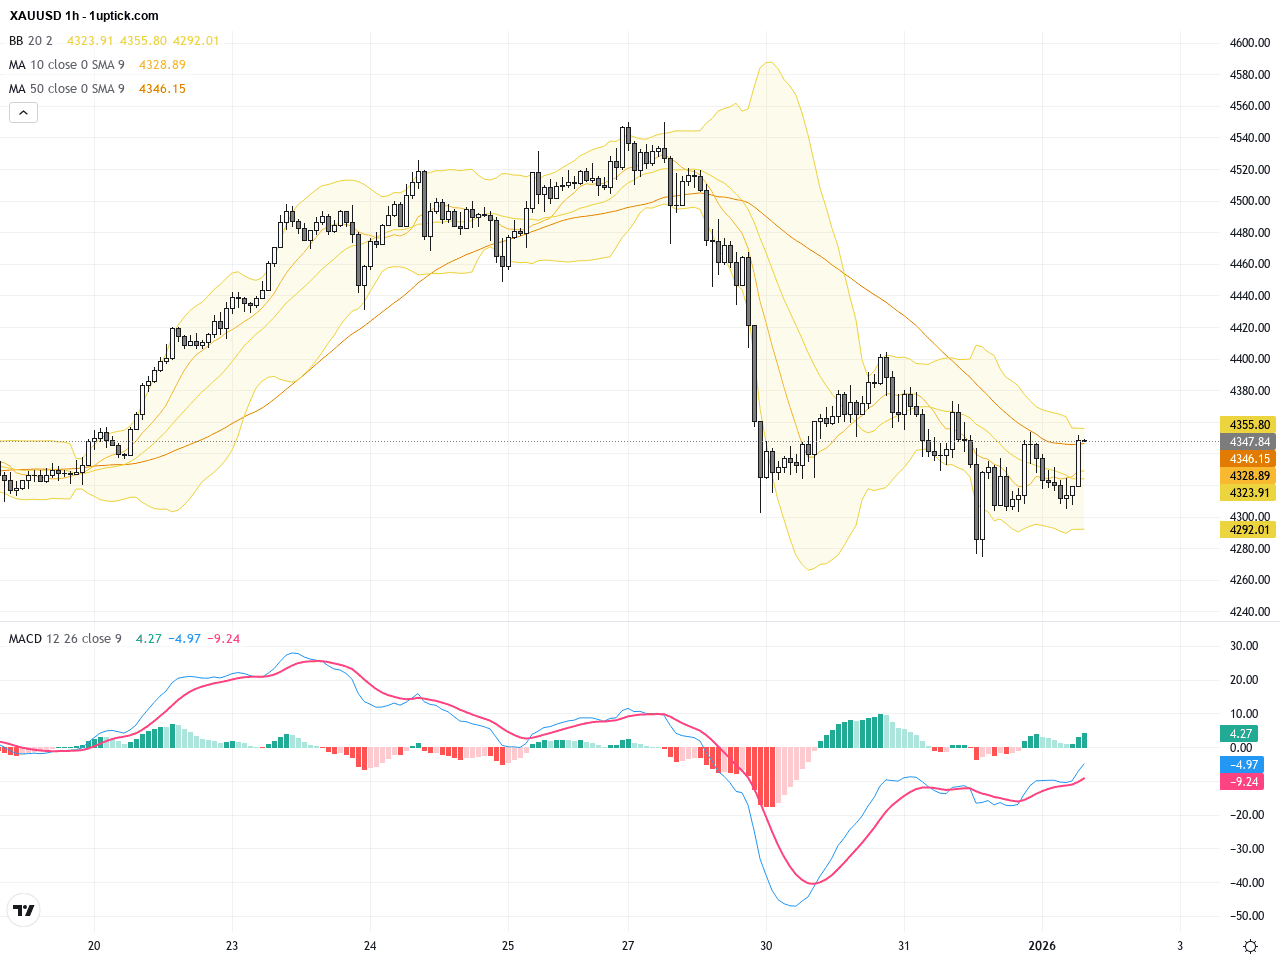
On the hourly chart covering the past 3–5 trading days, XAUUSD has exhibited intense volatility within a consolidation range. Price repeatedly oscillated between the upper and lower Bollinger Bands with frequent short-term moving average crossovers, indicating a balance of bullish and bearish forces. The MACD oscillates near the zero line without clear directional momentum. Thus, short-term price is likely to remain in the 4310 to 4350 range until a definitive breakout emerges.
Technical Trend: XAUUSD currently shows a cautiously consolidating trend, characterized as ‘Cautiously Sideways,’ with a tug-of-war between bulls and bears ongoing. Traders should await breakout confirmation for next directional cue.
Technically, XAUUSD is carving a potential symmetrical triangle consolidation pattern on the daily chart that began forming in late December 2025. A breakout above the upper trendline could accelerate bullish momentum. The most notable recent candlestick is a bearish engulfing pattern on January 1, signaling a possible short-term retracement. Attention to the critical support near 4320 is essential to gauge depth of pullback and future trend directions.Today’s global economic calendar does not list any significant events directly impacting XAUUSD. Traders should remain alert for changes in broader market sentiment, especially USD strength and risk appetite, which are key drivers of gold price movement.
Resistance & Support

The above financial market data, quotes, charts, statistics, exchange rates, news, research, analysis, buy or sell ratings, financial education, and other information are for reference only. Before making any trades based on this information, you should consult independent professional advice to verify pricing data or obtain more detailed market information. 1uptick.com should not be regarded as soliciting any subscriber or visitor to execute any trade. You are solely responsible for all of your own trading decisions.