 |
| Gold V.1.3.1 signal Telegram Channel (English) |

XAUUSD: Gold Tests Historic Highs Amid Rising Financial Instability Risks
2026-01-29 @ 05:01
Over the past 48 hours, gold (XAUUSD) has continued its upward trajectory, reaching a new high with the closing price on January 28 at $5,316.48. Multiple factors have driven this surge, notably a warning from former Atlanta Fed President Lockhart about rising financial instability risks, which has bolstered safe-haven demand and pushed gold prices higher.
Despite a recent rebound in the U.S. dollar, gold’s momentum remains strong, reflecting investor concerns over geopolitical tensions and global economic uncertainties. Analysts highlight that the weakness of the dollar acts as a significant tailwind for commodities, especially precious metals like gold. Meanwhile, Tether’s gold reserves have crossed 140 tons, valued at $24 billion, indicating robust private investor demand for gold.
For the average investor, this surge in gold prices underscores the value of allocating a portion of their portfolio to physical assets like gold amidst market volatility and monetary policy uncertainties. It shows why traditional safe-haven assets continue to play a crucial role in wealth preservation and risk diversification.
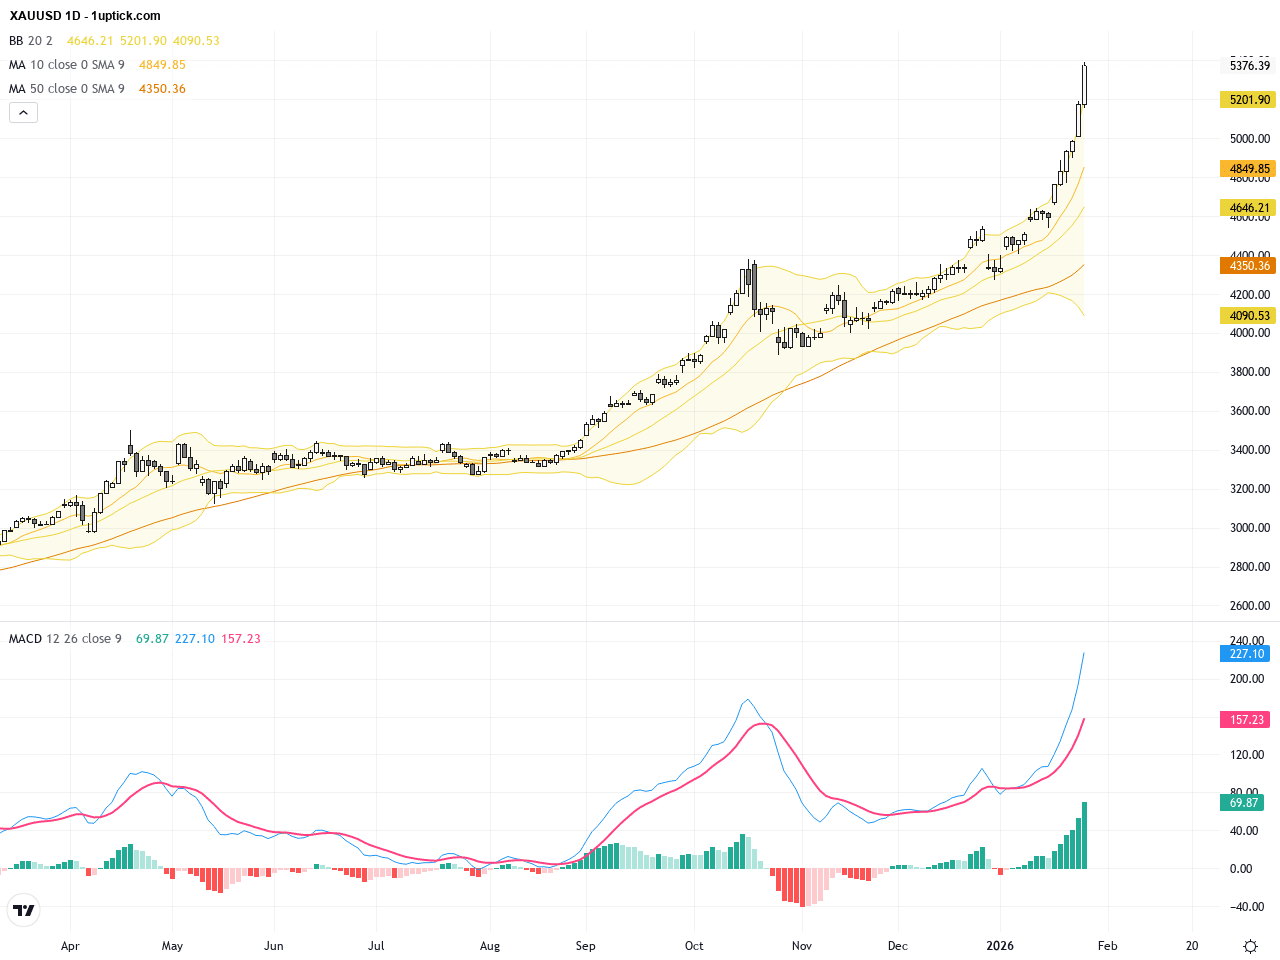
The daily chart shows a clear uptrend for XAUUSD since the start of the year, with the price breaking through multiple resistance levels and reaching historic highs above $5,300. Bollinger Bands are widening, indicating increasing volatility, and price is hugging the upper band, confirming strong bullish momentum. The MACD remains in high positive territory but is hinting at possible momentum slowing, suggesting a potential near-term pullback risk. Overall, the trend favors further upside but caution is advised given momentum signals.
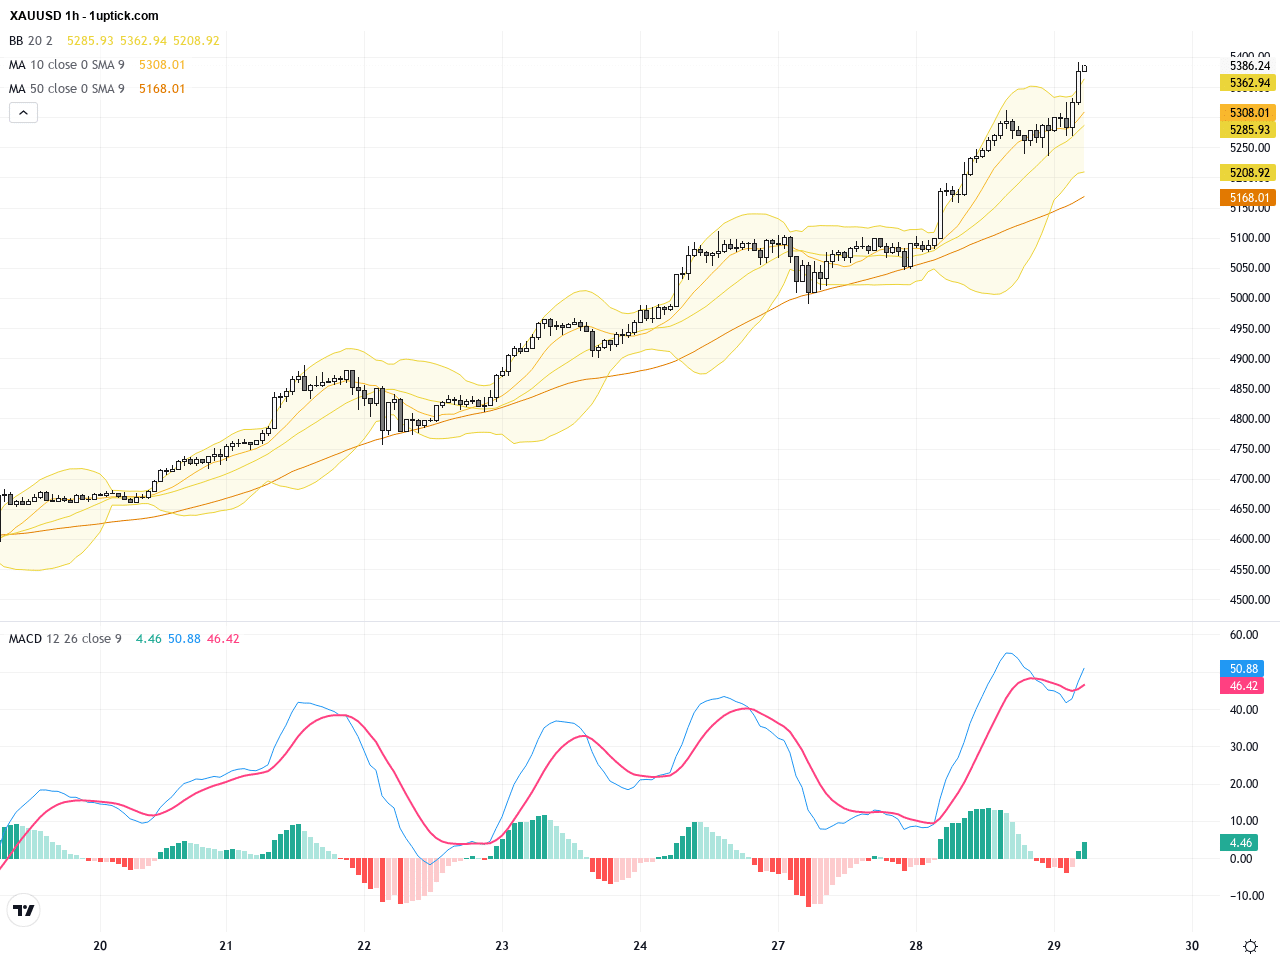
The hourly chart over the past 5 days reveals that after breaking above the $5,300 level, gold has entered a consolidation phase with waves of oscillation. The Bollinger Bands have contracted, signaling a potential end to the sideways movement. Short-term moving averages maintain a bullish alignment, while the MACD histogram shows slight contraction, indicating waning bullish momentum. A recent bullish engulfing candlestick pattern suggests buyers retain control and if the key support near $4,990 holds, another leg higher could unfold.
Technical Trend: Current trend status is “Cautiously Bullish” reflecting sustained upward momentum with signs of short-term exhaustion and possible consolidation before continuation.
Technical indicators show that although momentum remains strong for XAUUSD, the MACD is showing signs of divergence and daily Bollinger Bands upper band pressure is mounting, suggesting a potential near-term correction. Critical support to watch is around $4,990, with deeper pullback zones between $4,824 and $4,703. The hourly chart’s bullish engulfing and moving averages support a cautiously bullish short-term stance. Investors should watch for shifts in the US dollar and geopolitical updates for high-probability trade signals.Today’s economic calendar highlights the US FOMC interest rate decision at 20:00 GMT+1 (4:00 HKT), expected to hold rates steady at 3.50-3.75%. This event is the most significant for XAUUSD as it directly influences the US dollar and thus gold prices. Other data such as Australia’s CPI and European consumer confidence have limited direct impact on gold. Market reaction to the FOMC’s tone could therefore prompt notable movements in gold prices.
Resistance & Support

The above financial market data, quotes, charts, statistics, exchange rates, news, research, analysis, buy or sell ratings, financial education, and other information are for reference only. Before making any trades based on this information, you should consult independent professional advice to verify pricing data or obtain more detailed market information. 1uptick.com should not be regarded as soliciting any subscriber or visitor to execute any trade. You are solely responsible for all of your own trading decisions.