


 |
| Gold V.1.3.1 signal Telegram Channel (English) |
XAUUSD Technical & Fundamental Analysis: Gold Surges Past $5,100 Key Resistance
2026-01-27 @ 02:53
Over the past 24 to 48 hours, gold (XAUUSD) has shown remarkable strength, climbing above yesterday’s closing price of $5,072.64 per ounce and reaching an intraday high of $5,111.11. This substantial price surge has been driven by several key factors: expectations of Federal Reserve easing, a surge in ETF inflows, and increased safe-haven demand amid escalating geopolitical tensions worldwide.
Market reports highlight that gold prices have not only crossed the $5,000 mark but some analysts are bullish on further gains, projecting prices could reach $6,000. This rally has also boosted precious metals mining shares, reflecting heightened market enthusiasm for metals. Moreover, crypto traders are diversifying their portfolios by moving into traditional assets like gold and silver, which has contributed to higher trading volumes.
For the average investor, this trend underscores gold’s growing appeal as a safe-haven asset amid global economic and political uncertainty. Despite volatility in equities, gold remains a reliable store of value and an essential part of diversified investment portfolios. Investors should stay alert to upcoming Federal Reserve policy signals and geopolitical developments, as these will remain critical drivers of gold’s price trajectory going forward.

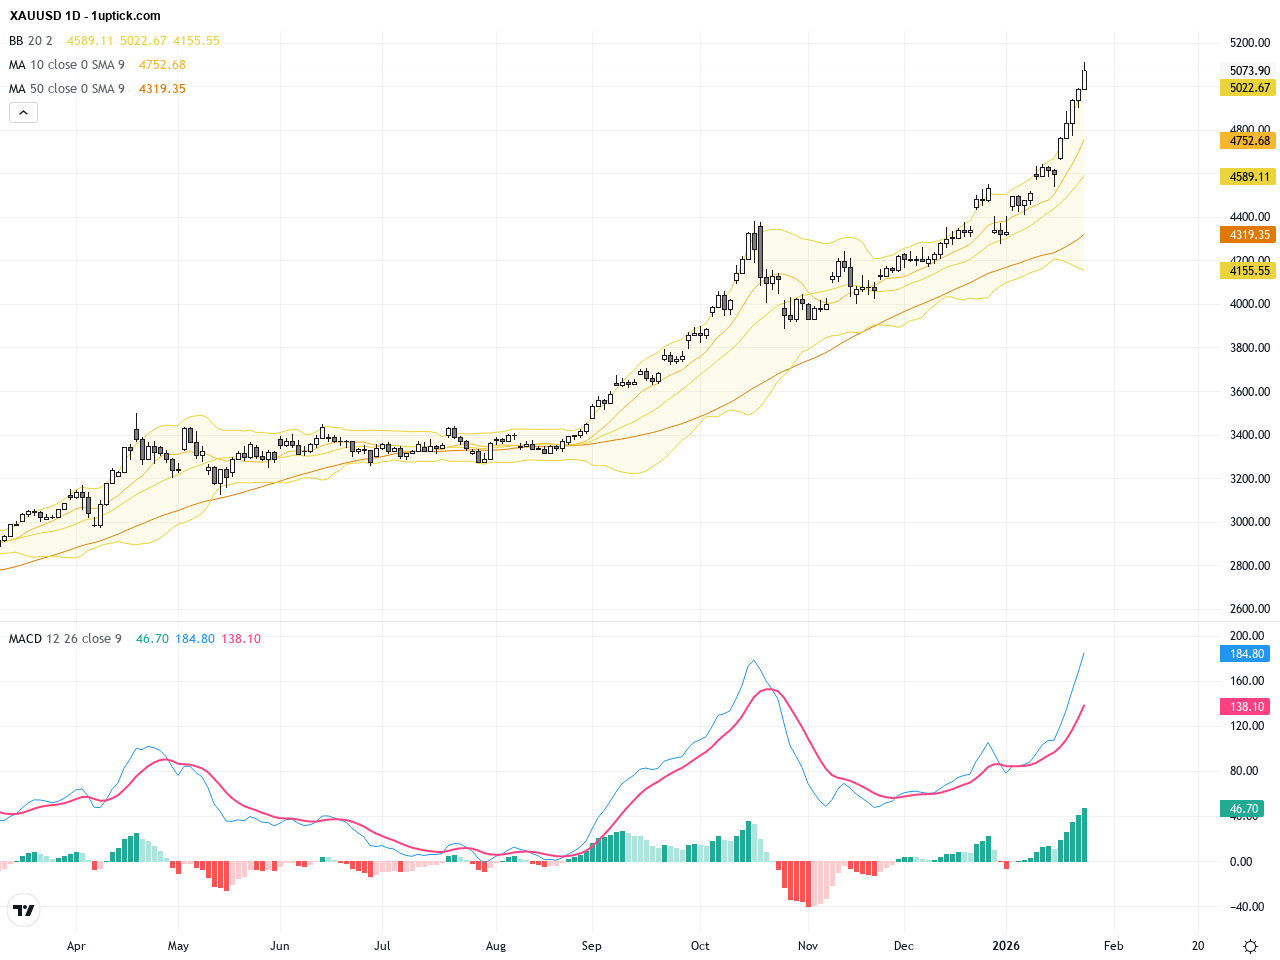
The daily chart shows a robust uptrend for XAUUSD since early January, with prices consistently closing above both the 50-day and 100-day moving averages. The Bollinger Bands are expanding, signaling increased volatility. The MACD is trending positively above the zero line, confirming strong bullish momentum. No immediate signs of reversal are apparent, supporting a continued bullish bias in the medium term.
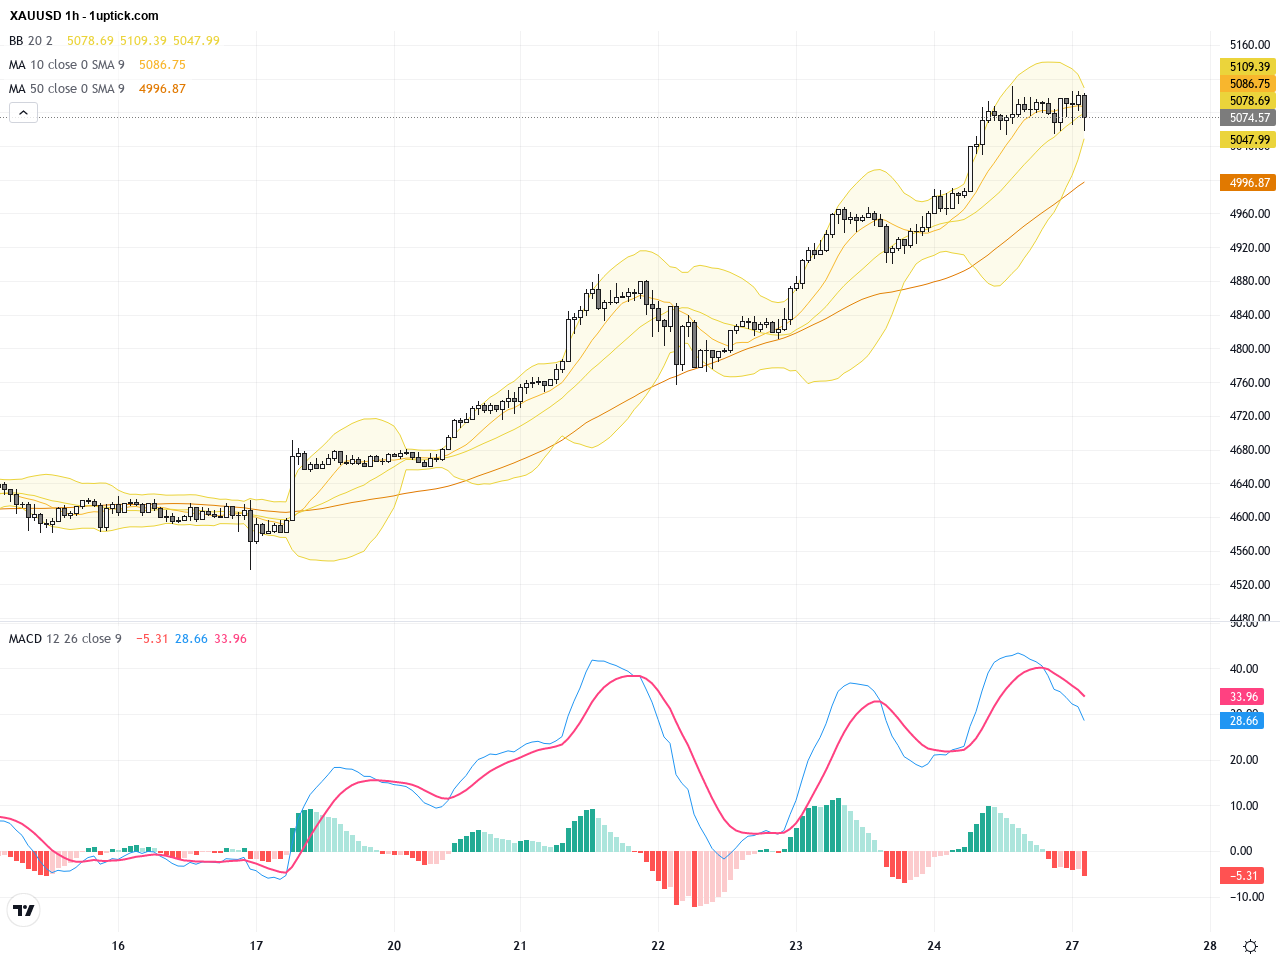
On the 1-hour chart over the past 3-5 days, XAUUSD has been climbing in a stair-step manner, forming a bullish flag consolidation pattern recently. The 50-period moving average has crossed above the 200-period, forming a golden cross. The MACD remains positive, signaling sustained short-term bullish strength. A recent bullish engulfing candlestick suggests potential for further upside. Traders should watch the consolidation range for a breakout trade opportunity.
Technical Trend: Trend Direction: Decisively Bullish trend with strong price structure and positive market sentiment.
Technical indicators reveal a well-established bullish alignment on the daily timeframe, supported by MACD and moving averages. The hourly chart’s bullish flag and engulfing candlestick pattern point to the possibility of an imminent breakout to the upside. A move above the flag’s upper boundary near $5,100 would likely trigger another extension in price gains. Volume and momentum changes at key support and resistance levels should be closely monitored for high-probability entries.Today’s economic calendar includes Germany’s Ifo Business Climate, Poland’s Retail Sales, and US Durable Goods Orders. These data points have limited direct impact on XAUUSD but may influence gold indirectly via currency fluctuations. Strong US Durable Goods figures could support the USD and pressure gold prices slightly; weaker results could have the opposite effect. No major direct events are expected to cause immediate moves in gold prices today.
Resistance & Support

The above financial market data, quotes, charts, statistics, exchange rates, news, research, analysis, buy or sell ratings, financial education, and other information are for reference only. Before making any trades based on this information, you should consult independent professional advice to verify pricing data or obtain more detailed market information. 1uptick.com should not be regarded as soliciting any subscriber or visitor to execute any trade. You are solely responsible for all of your own trading decisions.