


 |
| Gold V.1.3.1 signal Telegram Channel (English) |

AUDUSD: Key Golden Cross Signals Short-Term Pullback Risk with Vital Trading Outlook
2026-02-18 @ 06:01
Over the past 24 to 48 hours, the Australian Dollar against the US Dollar (AUD/USD) experienced notable volatility, declining from yesterday’s closing price of 0.70719 down to around 0.7050 today, a drop of roughly 0.40%. This weakening was primarily driven by market reaction to the Reserve Bank of Australia’s (RBA) minutes release, which offered no fresh stimulus, leaving investors in a cautious stance.
Meanwhile, with the upcoming Federal Reserve minutes expected soon, the US Dollar has remained cautious amid these mixed signals. Although weaker US retail sales data earlier this week bolstered bets on a potential rate cut, overall risk appetite continues to struggle, resulting in capital flowing toward safer currencies and weighing on the Australian Dollar.
For the everyday investor, this scenario is akin to a cautious mood prevailing before a major meeting, where no one is willing to take big risks—causing the AUD to pull back. After a strong rally since mid-January, the lack of clear positive triggers from the RBA minutes has led to more conservative positioning, and the slight dip in AUD/USD reflects these subtle shifts in market sentiment.
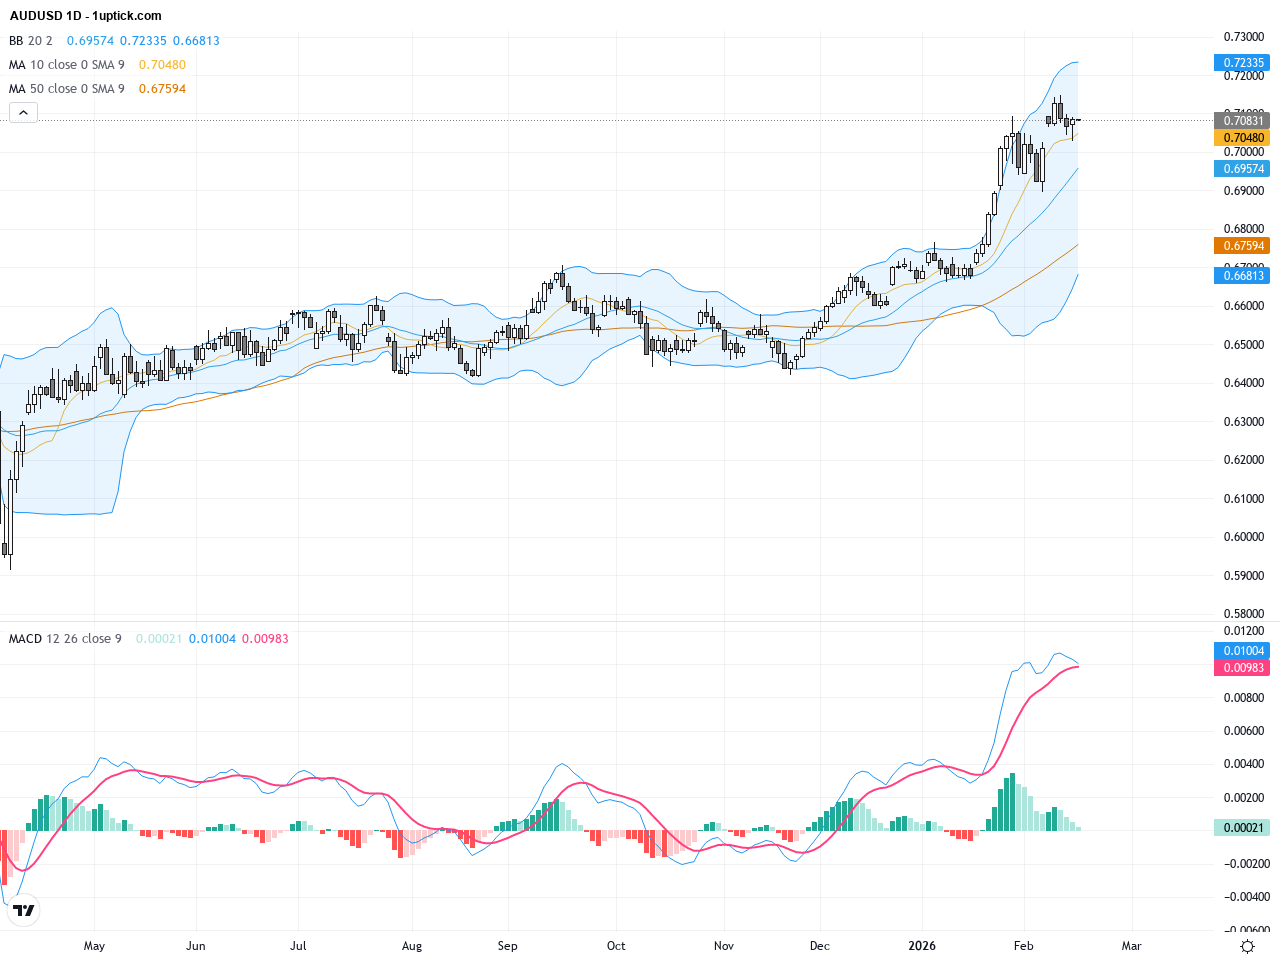
The daily chart of AUDUSD shows a sustained uptrend since mid-January, with prices maintaining above the 20-day EMA, indicating a bullish medium-term trend. A recent golden cross suggests possible momentum shifts. The Bollinger Bands are tightening, signaling a potential volatility squeeze ahead. However, the MACD histogram is showing signs of weakening momentum, hinting at a possible short-term correction or consolidation phase. Traders should watch for any breakout or breakdown from these zones.
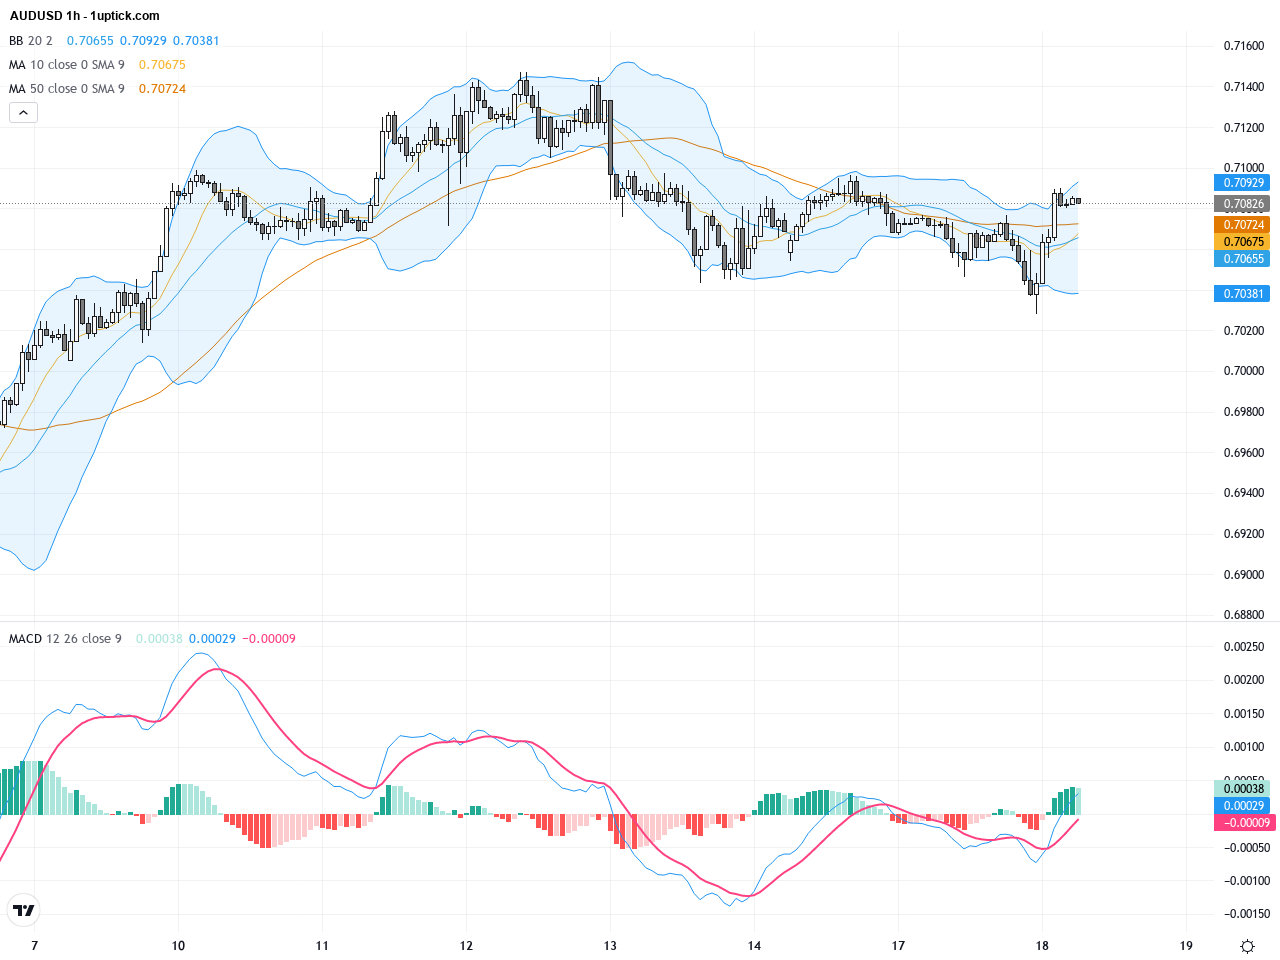
The hourly chart over the past 3-5 days illustrates increased short-term volatility with wider Bollinger Bands and intertwined 20 and 50-period moving averages, reflecting indecision between bulls and bears. Multiple hammer candlesticks indicate solid support at lower levels. The MACD recently formed a bearish crossover, suggesting downside risk may increase if momentum continues. Monitoring key support levels and technical signals will be essential for short-term trade setups.
Technical Trend: AUDUSD is currently in a cautiously bearish consolidation phase with increased volatility, awaiting clearer directional cues from fundamental data and technical confirmation.
Technical insights reveal that while the daily chart shows a golden cross, momentum indicators like MACD and RSI signal underlying weakness, raising the risk of a near-term pullback. The hourly chart’s hammer candles and lower Bollinger Band support suggest potential short-term stabilization. Lack of broad volume spikes indicates balanced pressure among buyers and sellers. Traders should focus on momentum and volume shifts to identify possible breakout or breakdown trades.Today’s economic calendar highlights the release of the Australian RBA Minutes at 01:30 GMT+1, a key event for AUDUSD. The minutes reaffirm a cautious policy stance with no new stimulus cues, which the market has largely priced in. Other data such as UK employment figures have limited direct impact on AUDUSD. Additionally, FOMC officials’ speeches later in the day could influence the US dollar and indirectly affect AUDUSD. Overall, there are no major unexpected events expected to dramatically shift AUDUSD today, but traders should remain alert to USD movements and central bank communications.
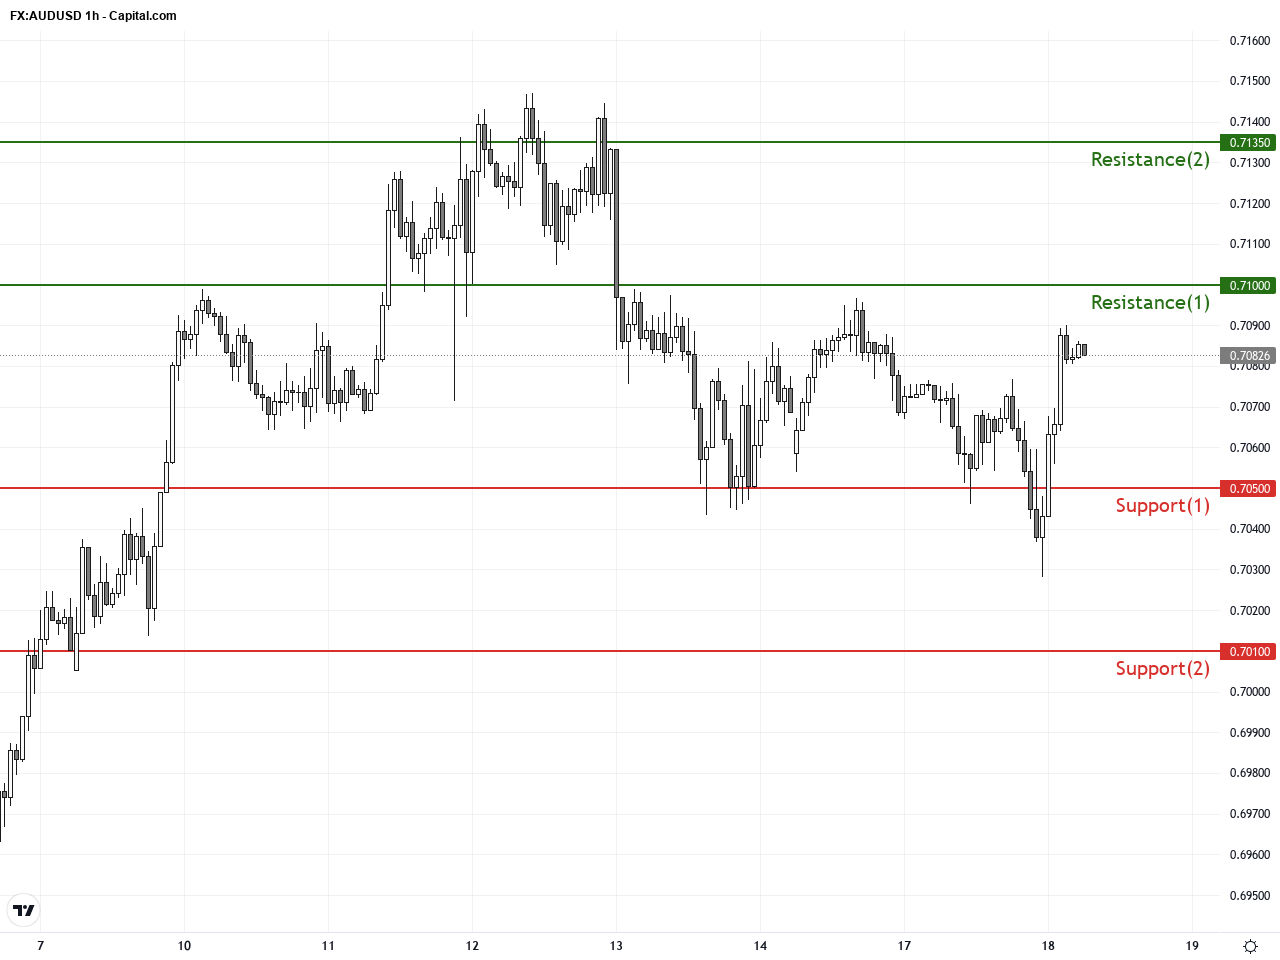
Resistance & Support
The above financial market data, quotes, charts, statistics, exchange rates, news, research, analysis, buy or sell ratings, financial education, and other information are for reference only. Before making any trades based on this information, you should consult independent professional advice to verify pricing data or obtain more detailed market information. 1uptick.com should not be regarded as soliciting any subscriber or visitor to execute any trade. You are solely responsible for all of your own trading decisions.