


 |
| Gold V.1.3.1 signal Telegram Channel (English) |
AUDUSD: Rate Hike Spurs Bullish Momentum Amid Hawkish RBA Outlook
2026-02-09 @ 06:01
Over the past 24 to 48 hours, AUD/USD experienced significant volatility, rising from yesterday’s closing price of 0.69258 to a high of 0.70248 last night, ultimately settling around 0.70136. The market was primarily driven by the Reserve Bank of Australia’s (RBA) long-awaited decision to raise interest rates for the first time in two years, hiking the official cash rate by 25 basis points.
At the same time, the U.S. Dollar Index (DXY) showed signs of weakness after testing the 98.00 level and investors remained cautious ahead of the upcoming Nonfarm Payrolls (NFP) report. The dollar’s softness combined with the RBA’s hawkish move supported the Australian dollar’s advance. However, a broad selloff in global equities and metals weighed on risk appetite, limiting bullish momentum for AUD/USD.
For the average investor, the last couple of days can be summed up as “RBA rate hike bolsters AUD, dollar softens briefly, but global risk-off mood caps further gains.” While the Aussie saw a notable bounce, it remains constrained by ongoing Federal Reserve hawkish signals and general market caution. Traders should watch the forthcoming US employment data and Fed guidance closely to better gauge AUD’s near-term trajectory.

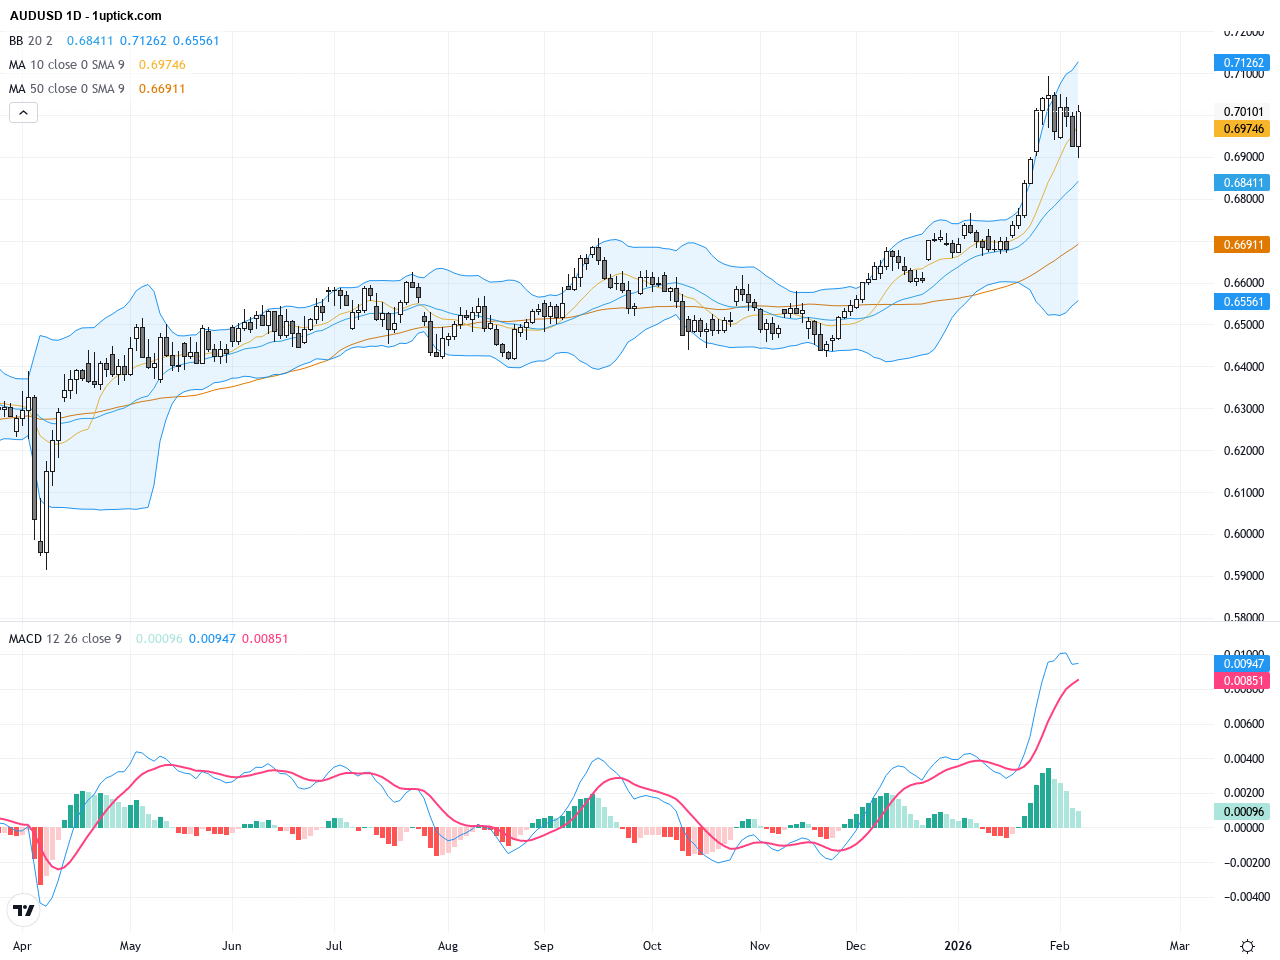
The daily chart reveals a clear uptrend as AUDUSD moves steadily higher from recent lows. The price remains comfortably above the 50-day (around 0.676) and 200-day (around 0.659) moving averages, confirming a long-term bullish bias. Bollinger Bands show moderate widening, signaling a slight uptick in volatility. The MACD maintains positive momentum bars but hints at possible momentum slowing, indicating the bullish run may face near-term challenges. Overall, the daily view supports a bullish stance fueled by the RBA rate hike, with caution advised regarding momentum sustainability.
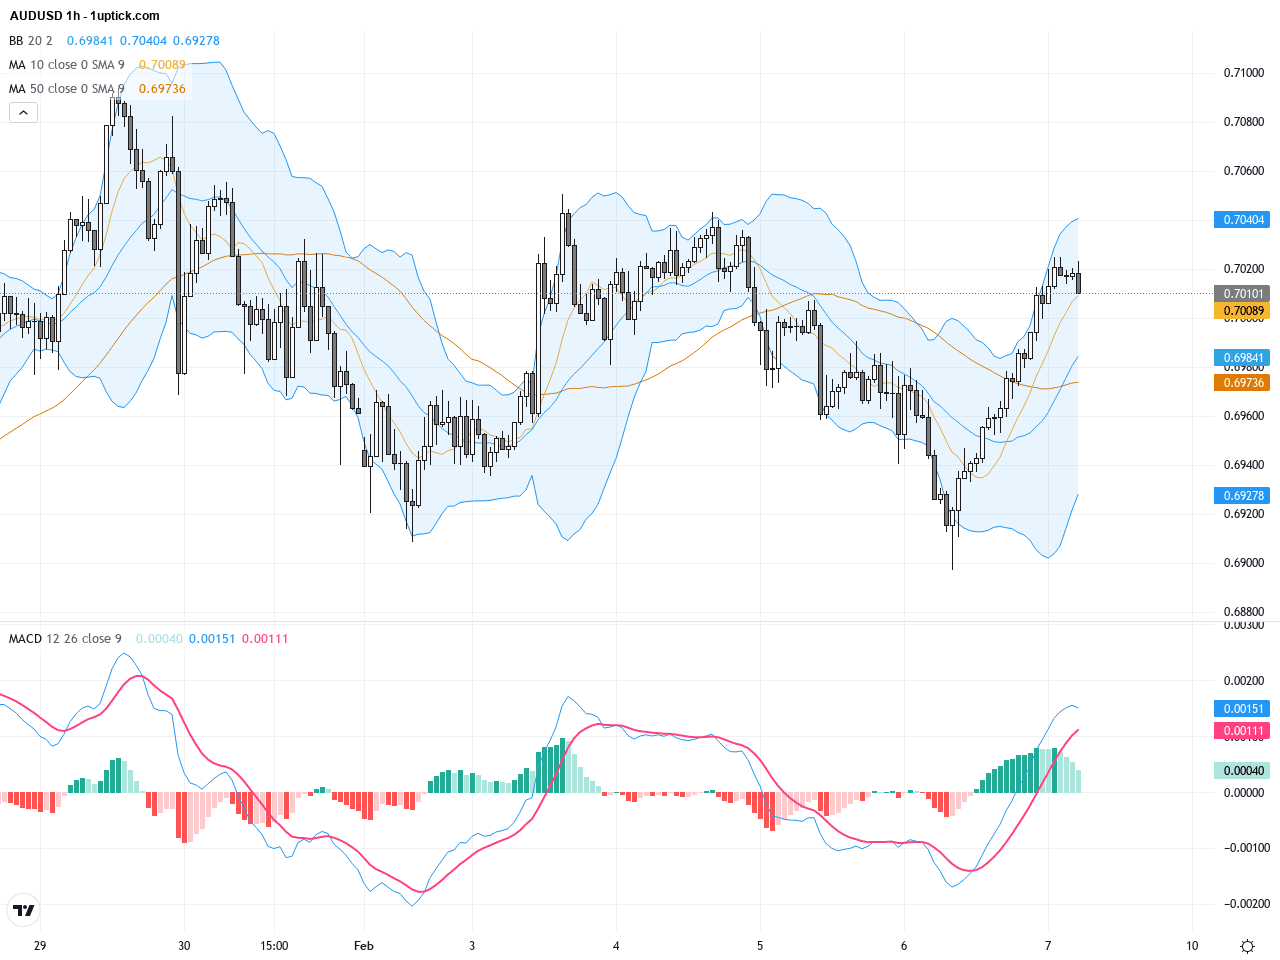
On the hourly chart, AUDUSD has maintained a short-term upward trend over the last 3 to 5 days, oscillating between 0.69 and 0.70. Short-term moving averages are intertwined, while the MACD recently formed a bullish crossover, reinforcing short-term buying confidence. The Bollinger Bands show slight expansion, suggesting increased volatility. A recent bullish engulfing candlestick pattern signals strong upside potential within the next 24 hours. Technically, the pair seems positioned to test higher resistance levels soon.
Technical Trend: Decisively Bullish
Technical analysis points to a confirmed bullish trend with solid support formed by the 50-day and 200-day moving averages on the daily chart. The bullish engulfing candlestick and MACD golden cross on the hourly chart indicate short-term upward momentum buildup. Potential risks include a USD rebound or hawkish Fed commentary triggering volatility, so traders must monitor momentum shifts and news flow closely.At 07:40 GMT+1, Bank of England Governor Bailey will deliver a speech. While this event holds limited direct impact on AUDUSD, primarily influenced by Australian and US economic data and monetary policies, market sentiment may experience slight fluctuations driven by GBP and USD volatility. Overall, no significant or direct economic releases today are expected to sway AUDUSD decisively.
Resistance & Support

The above financial market data, quotes, charts, statistics, exchange rates, news, research, analysis, buy or sell ratings, financial education, and other information are for reference only. Before making any trades based on this information, you should consult independent professional advice to verify pricing data or obtain more detailed market information. 1uptick.com should not be regarded as soliciting any subscriber or visitor to execute any trade. You are solely responsible for all of your own trading decisions.