


 |
| Gold V.1.3.1 signal Telegram Channel (English) |
EURUSD Technical & Fundamental Analysis: Key Support Holds Amid Dollar Volatility
2026-02-20 @ 09:01
Over the past 48 hours, the EUR/USD currency pair has experienced notable volatility, with prices slightly recovering from yesterday’s close at 1.17704 and currently trading around the 1.18 level, showing a range-bound intraday consolidation. The movement in the euro is largely driven by ongoing uncertainty surrounding the US dollar’s overall trend, particularly as the market awaits fresh US employment and retail sales data releases, leading to some short-term weakening of the greenback.
According to the latest market news, the US dollar index remains noisy amid mixed signals as investors assess whether the dollar’s strength can be sustained or is losing momentum. This uncertainty has provided EUR/USD with a brief rebound up to around 1.1923 intraday high. Meanwhile, reports of European Central Bank President Christine Lagarde’s possible departure caused the euro to initially weaken before sentiment improvements offered some recovery.
For the average investor, this scenario highlights two main factors in the forex market: first, the US dollar is still vulnerable to swings driven by economic data and policy signals; second, the euro is finding support as markets watch ECB policy stability and sentiment shifts. Thus, recent EUR/USD fluctuations reflect the market’s uncertainty over near-term monetary policy outlooks and potential volatility risks. Investors should monitor upcoming key economic releases closely, as rapid shifts in sentiment may lead to meaningful price swings.

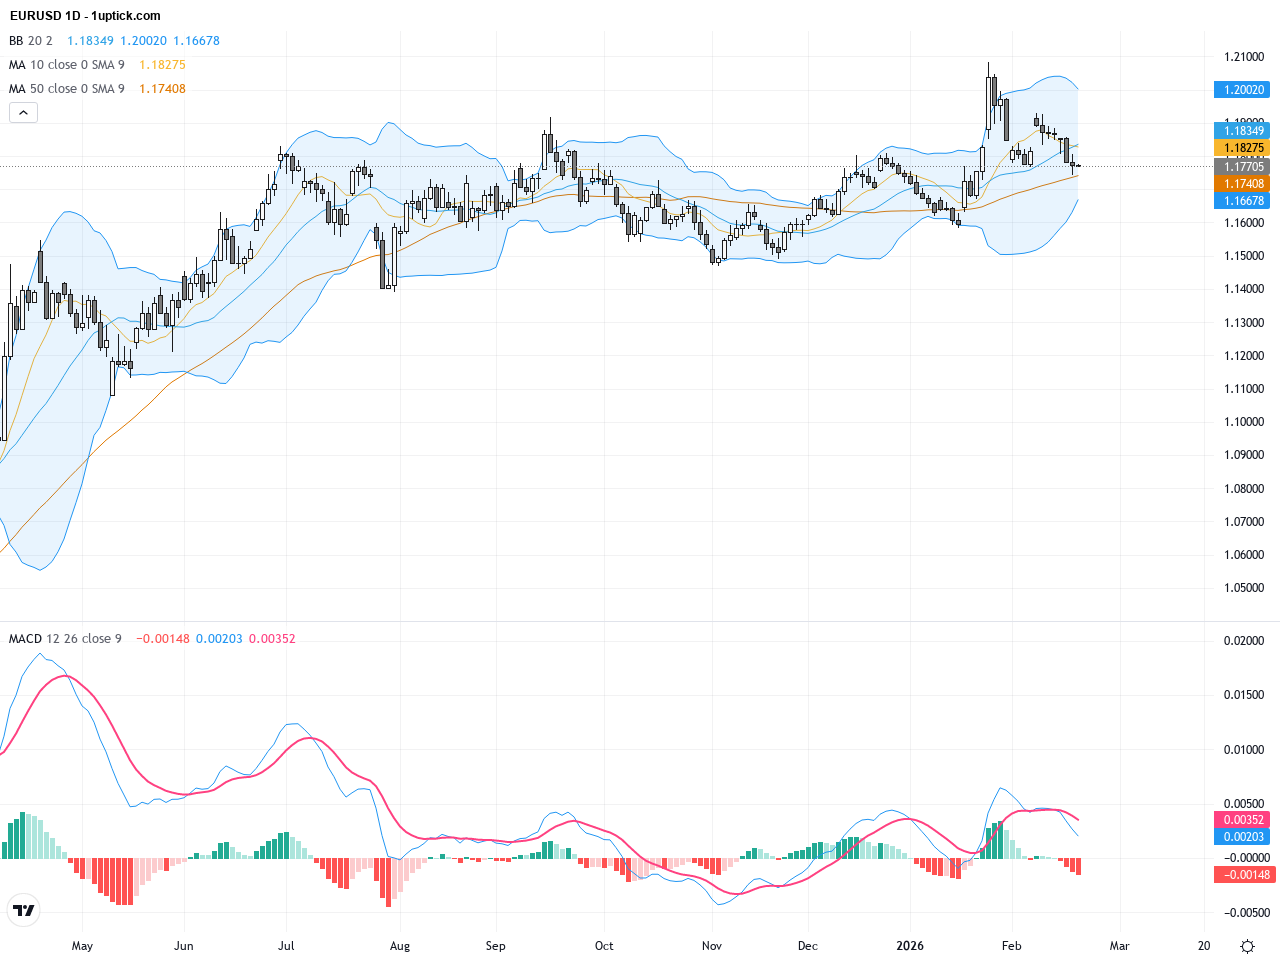
The daily chart shows EURUSD retreating from its high at 1.2083 down to around 1.1770, but still trading above the 200-day moving average near 1.1686, indicating an overall bullish longer-term trend. Bollinger Bands are narrowing, suggesting decreased volatility but potential breakout risk. MACD remains above zero but with shrinking histogram bars, signaling waning momentum. Technically, defending the 1.1800 support zone is crucial to preventing further downside continuation.
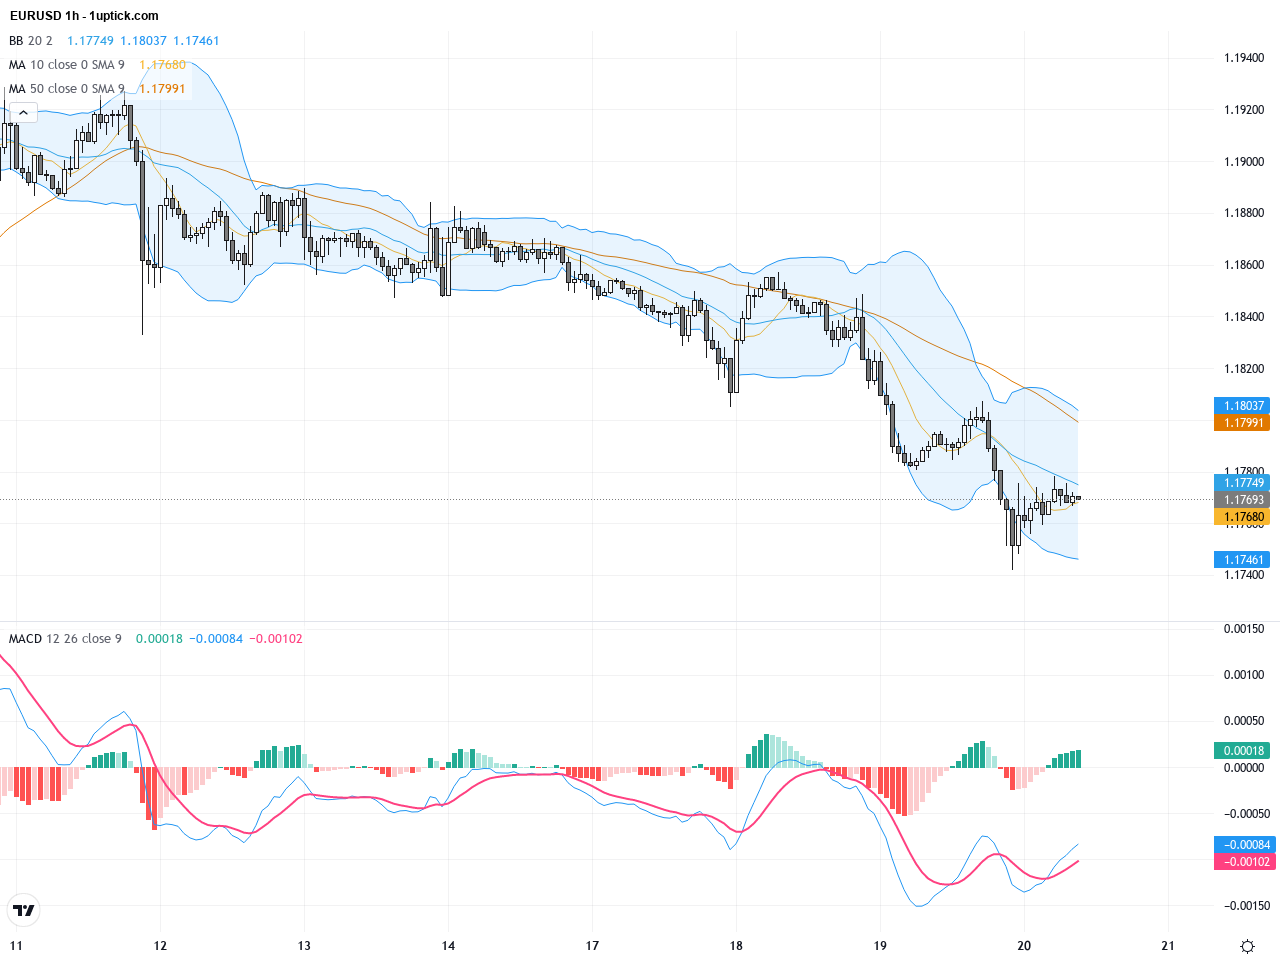
The hourly chart over the past 5 days reveals that EURUSD has hovered near the critical 1.1830 support, testing but not breaking below, forming a solid base. Short-term moving averages such as the 20 and 50 periods are converging, while MACD has shown a bullish divergence, suggesting a potential short-term rebound. The expanding Bollinger Band width indicates upcoming price volatility and possible breakout, warranting close monitoring of intraday moves.
Technical Trend: EURUSD currently exhibits a ‘cautiously consolidating’ trend, with short-term oscillation between rebound and retracement awaiting a clear breakout confirmation before directional moves.
Technically, EURUSD is positioned at a key support-resistance junction. MACD signaling a momentum shift indicates a possible near-term bullish rebound. The crucial 1.1800 support must hold to avoid further declines. Recent candlestick patterns such as hammer formations suggest buyers are stepping in to limit downside. Combined with fundamental market news, traders should closely watch the dollar movement and ECB developments for decisive market direction.Today’s GMT+1 economic calendar includes Eurozone Manufacturing and Services PMI releases at 10:00, expected to show minor improvement but no shock shifts. ECB President’s speech at 01:00 could trigger volatility in EURUSD, especially amid recent resignation rumors. Overall, today’s data and commentary are likely to cause short-term fluctuations without significantly altering the prevailing trend.
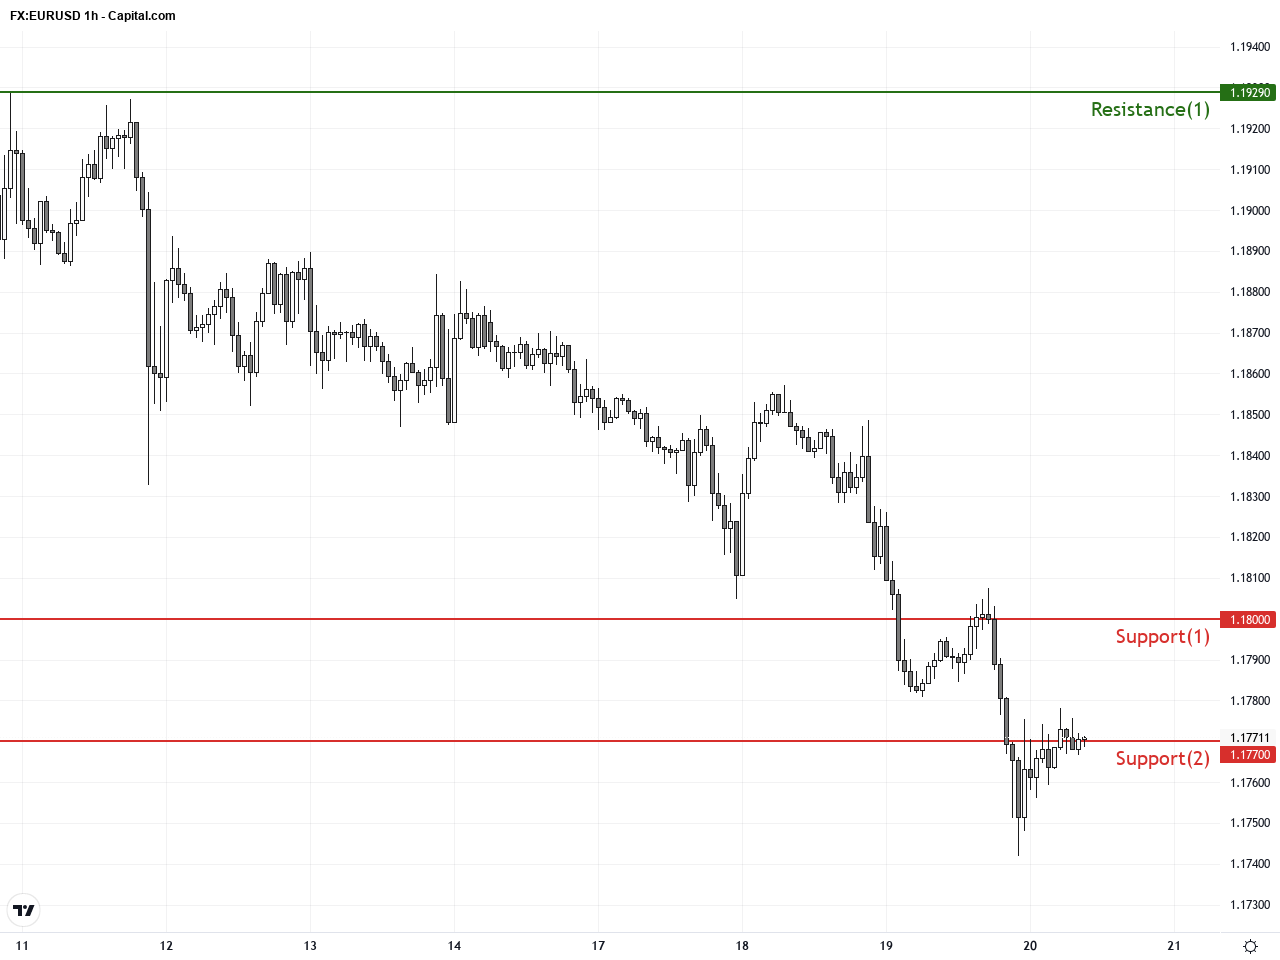
Resistance & Support
The above financial market data, quotes, charts, statistics, exchange rates, news, research, analysis, buy or sell ratings, financial education, and other information are for reference only. Before making any trades based on this information, you should consult independent professional advice to verify pricing data or obtain more detailed market information. 1uptick.com should not be regarded as soliciting any subscriber or visitor to execute any trade. You are solely responsible for all of your own trading decisions.