


 |
| Gold V.1.3.1 signal Telegram Channel (English) |

GBPUSD: Key Support Under Pressure – Trading Outlook and Technical Patterns Analysis
2026-02-02 @ 13:01
Over the past 24 to 48 hours, GBP/USD experienced notable volatility. Starting from yesterday’s closing price of 1.36818, the pair initially tested the 1.38 level this week but then retreated, briefly falling below 1.3750 amid shifting US economic data and political developments.
Recent market news highlights that GBP/USD slipped due to a stronger-than-expected US Producer Price Index (PPI) and the announcement of Kevin Warsh as the new Federal Reserve nominee, which bolstered the US dollar. These factors weighed on the British pound, causing it to soften and consolidate around the 1.37 mark. Meanwhile, China’s manufacturing PMI edged up to 50.3, providing modest support to global risk sentiment but having limited direct impact on the pound’s near-term moves.
For the average investor, this scenario underscores how global economic releases and political events continue to sway the forex market, particularly the alternating strength between the dollar and pound. GBP holders should keep a close eye on the upcoming Federal Reserve policy meeting and economic data, which will be pivotal in shaping the pound’s next directional move.
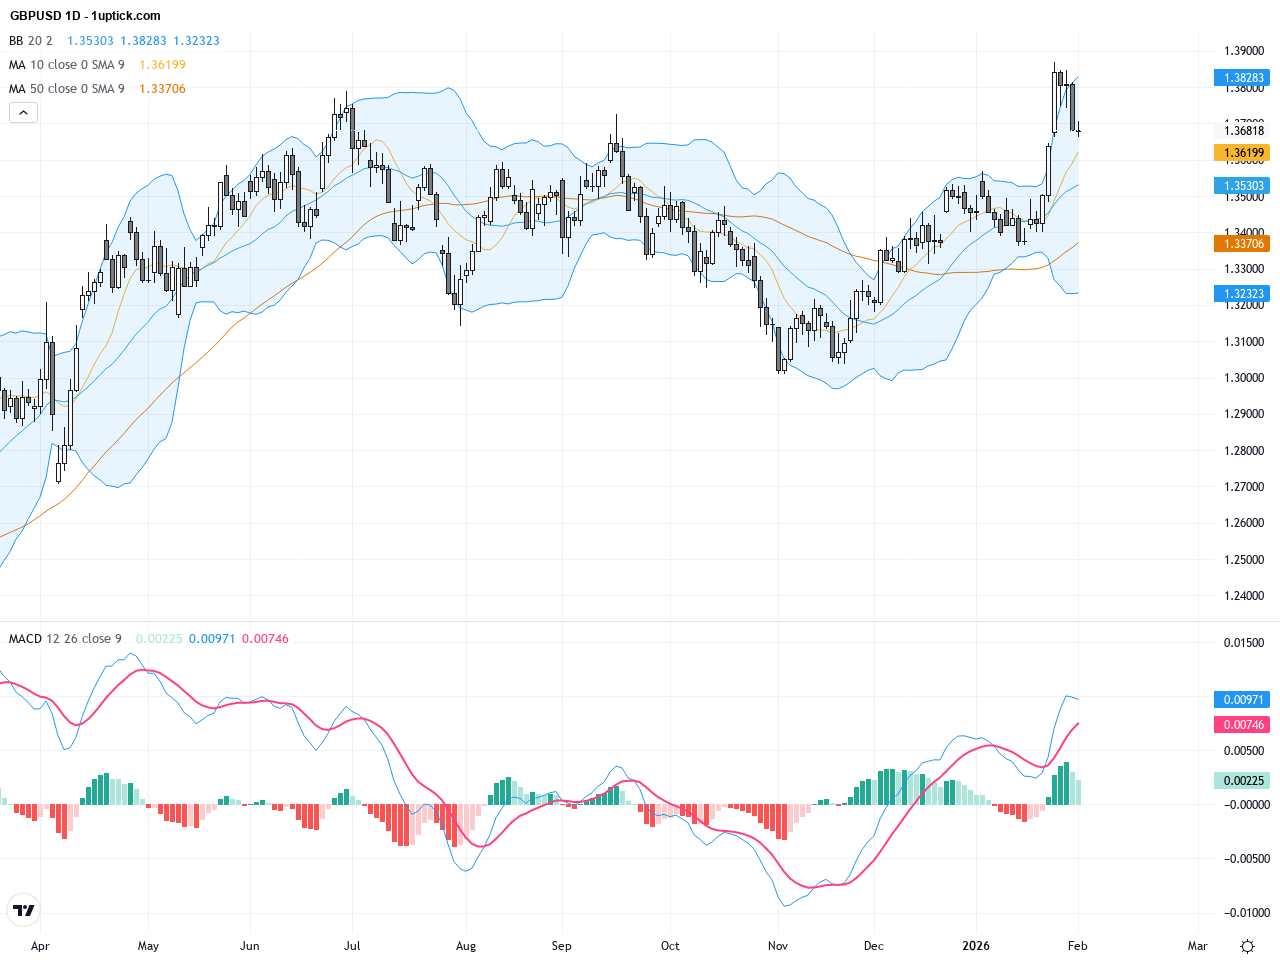
The daily chart shows GBPUSD fluctuating within a range, retreating from a yearly high of 1.38688 and now trading between 1.36 and 1.38. The 50-day moving average is trending upwards and price remains above the 200-day moving average, indicating medium-term bullish bias. However, repeated failure to break 1.38 resistance creates notable selling pressure. Bollinger Bands are contracting, suggesting diminished volatility and the potential for an impending breakout. MACD momentum is waning, signaling a possible slow down in bullish momentum.
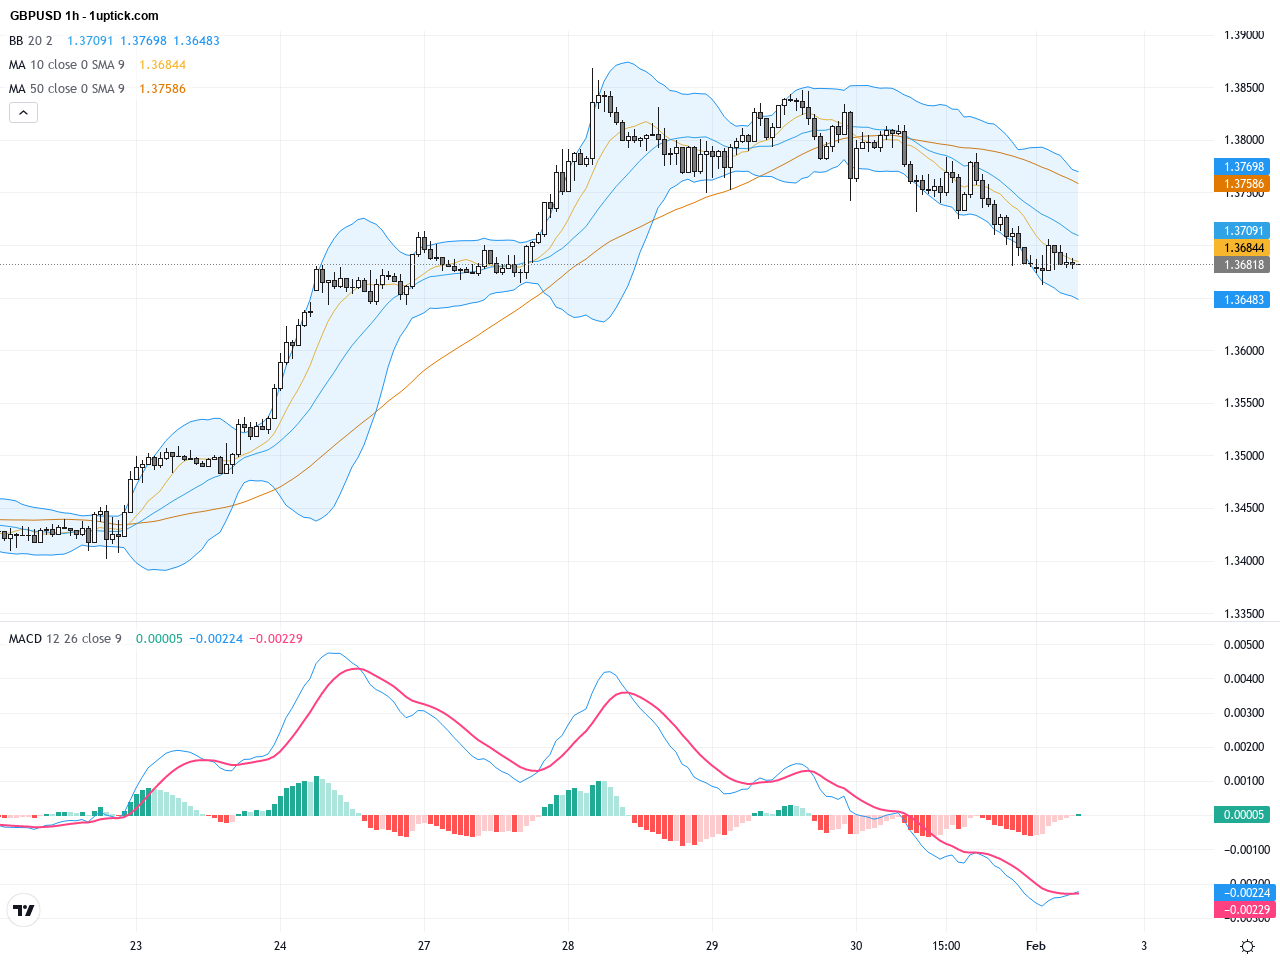
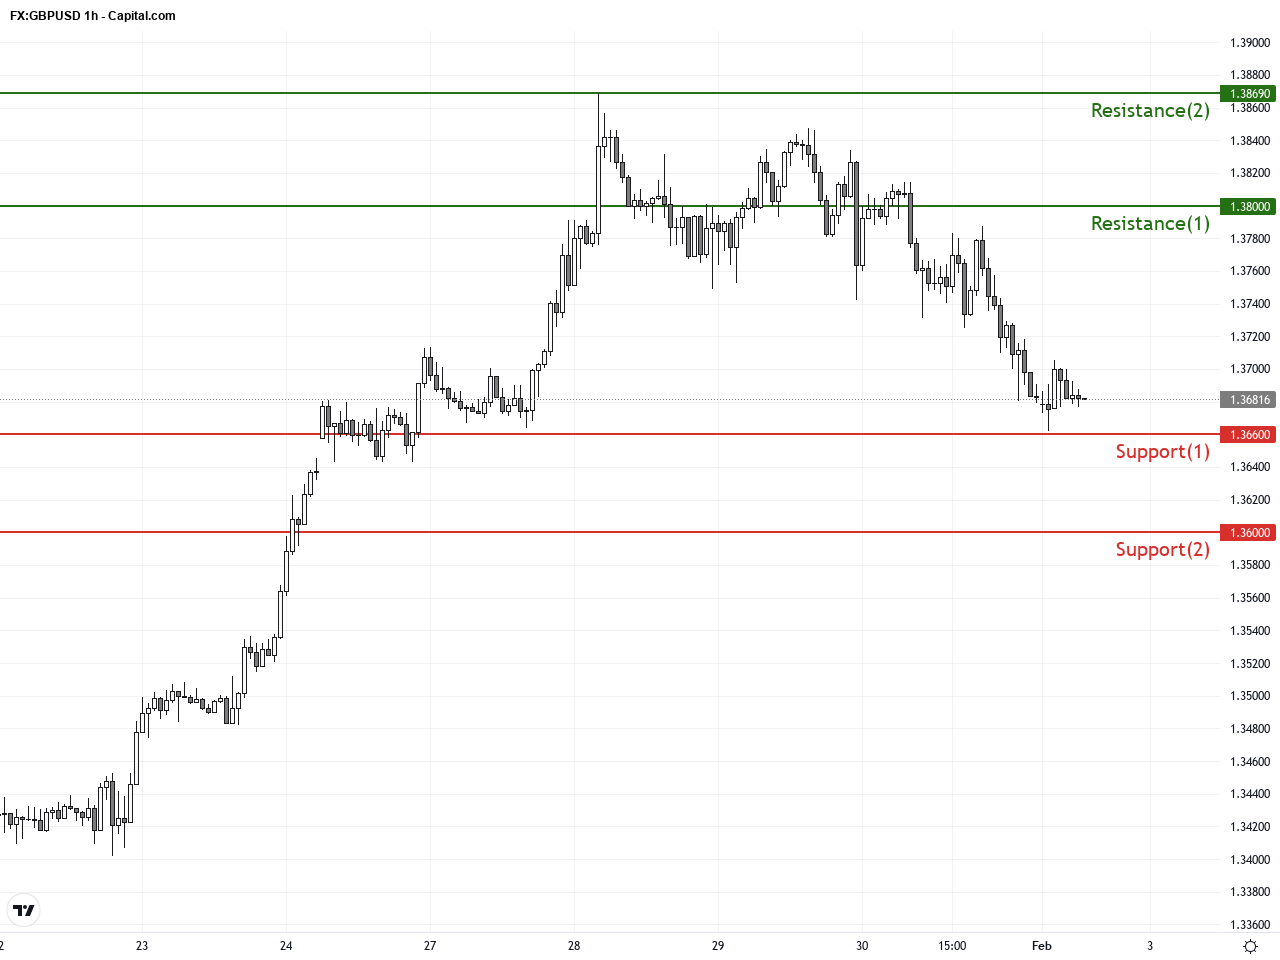
On the hourly chart, GBPUSD has been consolidating with a mild uptrend over the past 3-5 days, establishing support around 1.37. Price oscillates between the 21 and 50 EMA, reflecting short-term tug-of-war. A flag pattern is forming, indicating a potential buildup before a breakout. A recent bullish engulfing candlestick points to buyers stepping back in, though confirmation through increased volume is needed. Monitoring for a MACD golden cross or RSI shifts will provide clearer short-term trade signals.
Technical Trend: Consolidation with cautious bullish signals
Technically, GBPUSD faces strong resistance at the 1.3800 level. The flag consolidation pattern on the hourly chart suggests potential continuation if broken. Daily Bollinger Bands are tightening and MACD shows slowing momentum, indicating a possible pause or correction. On the shorter timeframe, the bullish engulfing candle signals renewed buying interest. RSI near neutral hints at waiting for directional cues. Watch for breakout confirmation supported by volume for high-probability trades.Today’s GMT+1 calendar highlights the UK’s January Nationwide House Prices forecast at 0.3% MoM, an improvement from December’s -0.4%, likely supportive for GBP. Meanwhile, US will release January Manufacturing PMI and ISM Manufacturing Index later in the day. Positive surprises could strengthen USD, generally weighing on GBPUSD. Traders should watch these releases closely as they hold the potential to stimulate notable intraday price swings in the pair.
Resistance & Support
The above financial market data, quotes, charts, statistics, exchange rates, news, research, analysis, buy or sell ratings, financial education, and other information are for reference only. Before making any trades based on this information, you should consult independent professional advice to verify pricing data or obtain more detailed market information. 1uptick.com should not be regarded as soliciting any subscriber or visitor to execute any trade. You are solely responsible for all of your own trading decisions.