


 |
| Gold V.1.3.1 signal Telegram Channel (English) |
GBPUSD: Key Trendline Break Signals Potential 470-Pip Decline – Trading Outlook
2026-02-25 @ 13:02
Over the past 24 to 48 hours, GBP/USD experienced moderate fluctuations, closing yesterday at 1.35166, slightly up from the prior day’s 1.34848. Market attention centered on the U.S. Consumer Confidence index jumping to 91.2, pointing to a robust economic outlook that strengthened the dollar and put pressure on the pound. However, UK inflation data cooling to its lowest level since March 2025 at 3.0%, alongside persistent services sector inflation, provided some support for the pound.
Additionally, upcoming speeches from Bank of England Governor Bailey and Monetary Policy Committee members have injected uncertainty regarding the pound’s near-term direction. With the dollar remaining broadly strong, GBP/USD saw a noticeable pullback midweek as traders anticipate the delayed U.S. Nonfarm Payrolls report later this week, which could spark fresh market moves. For the average investor, this means the GBP/USD exchange rate is likely to face volatility driven by economic data releases and policy commentary in the coming days. Both short-term traders and long-term investors should stay alert to these evolving factors.

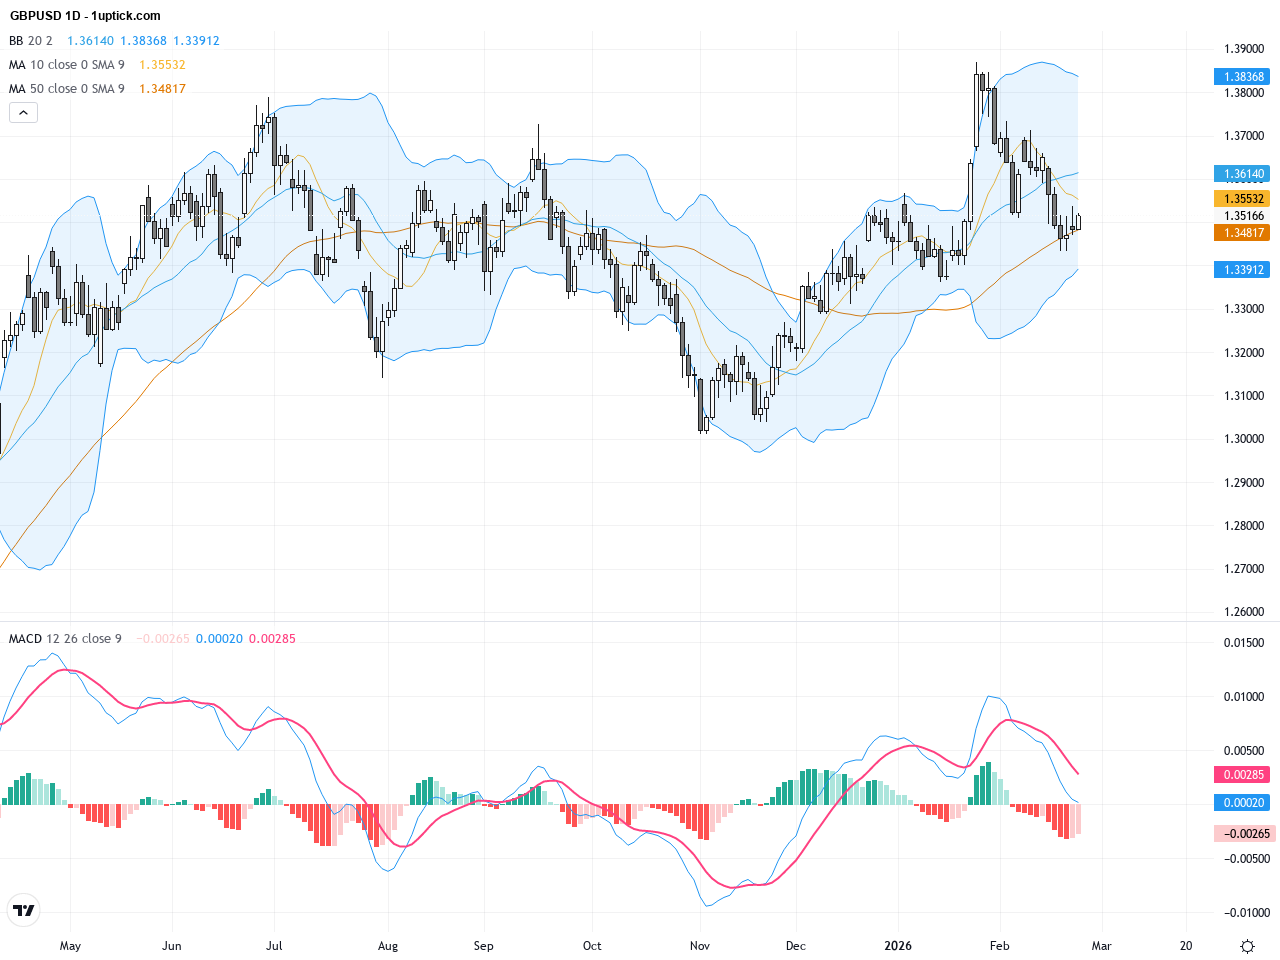
The daily chart reveals a clear downtrend in GBPUSD. Price has steadily fallen from a recent peak near 1.375 and broke below a significant ascending trendline earlier this week, marking a bearish technical signal. The 50 and 200-day moving averages indicate selling pressure, with the 200-day acting as a critical support currently under threat. Bollinger Bands show price nearing the lower band, suggesting heightened short-term volatility risk. Additionally, the MACD indicator has formed a bearish crossover, signaling sustained selling momentum and an overall weak trend.
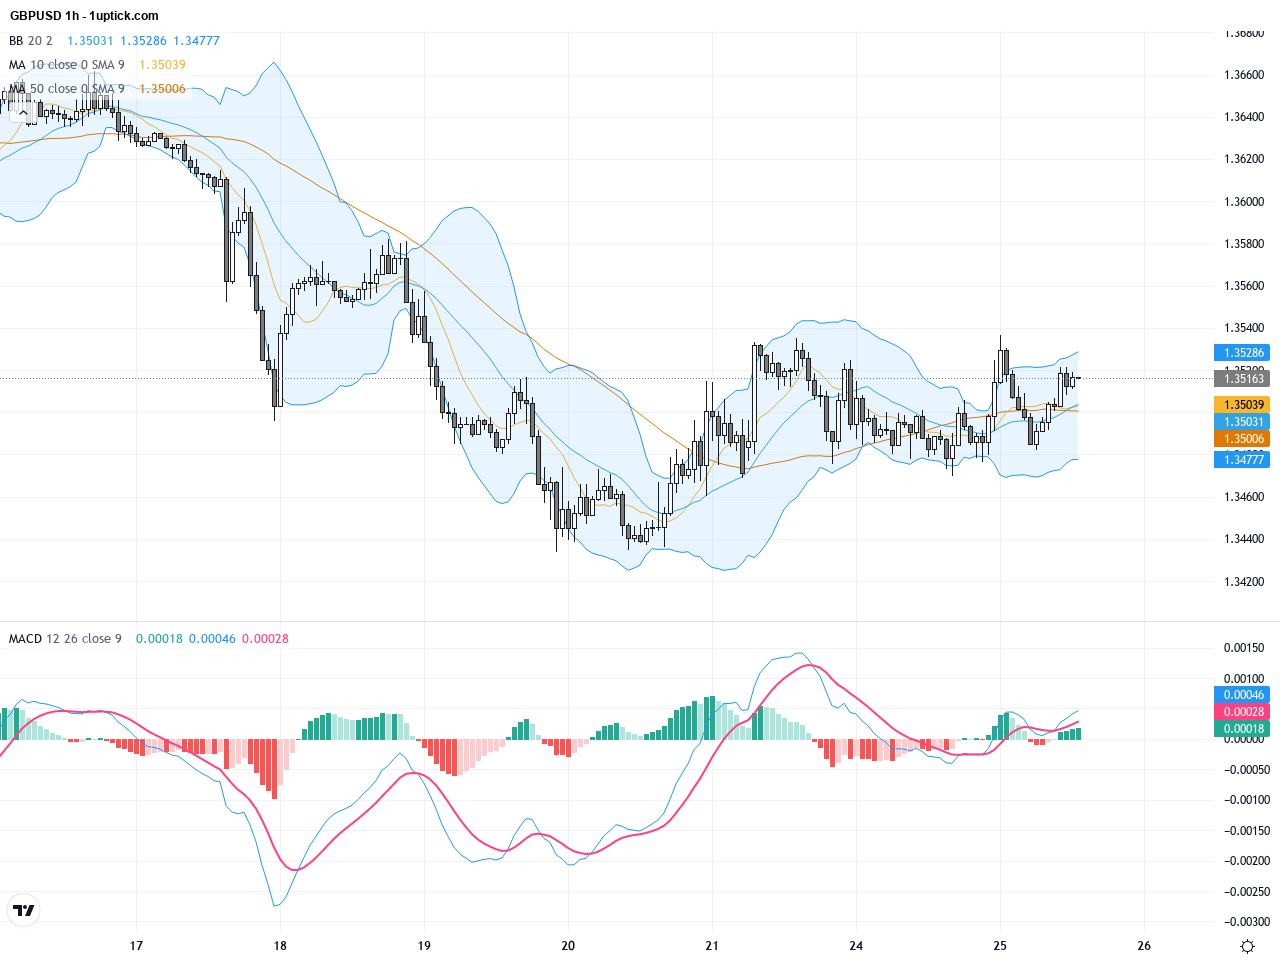
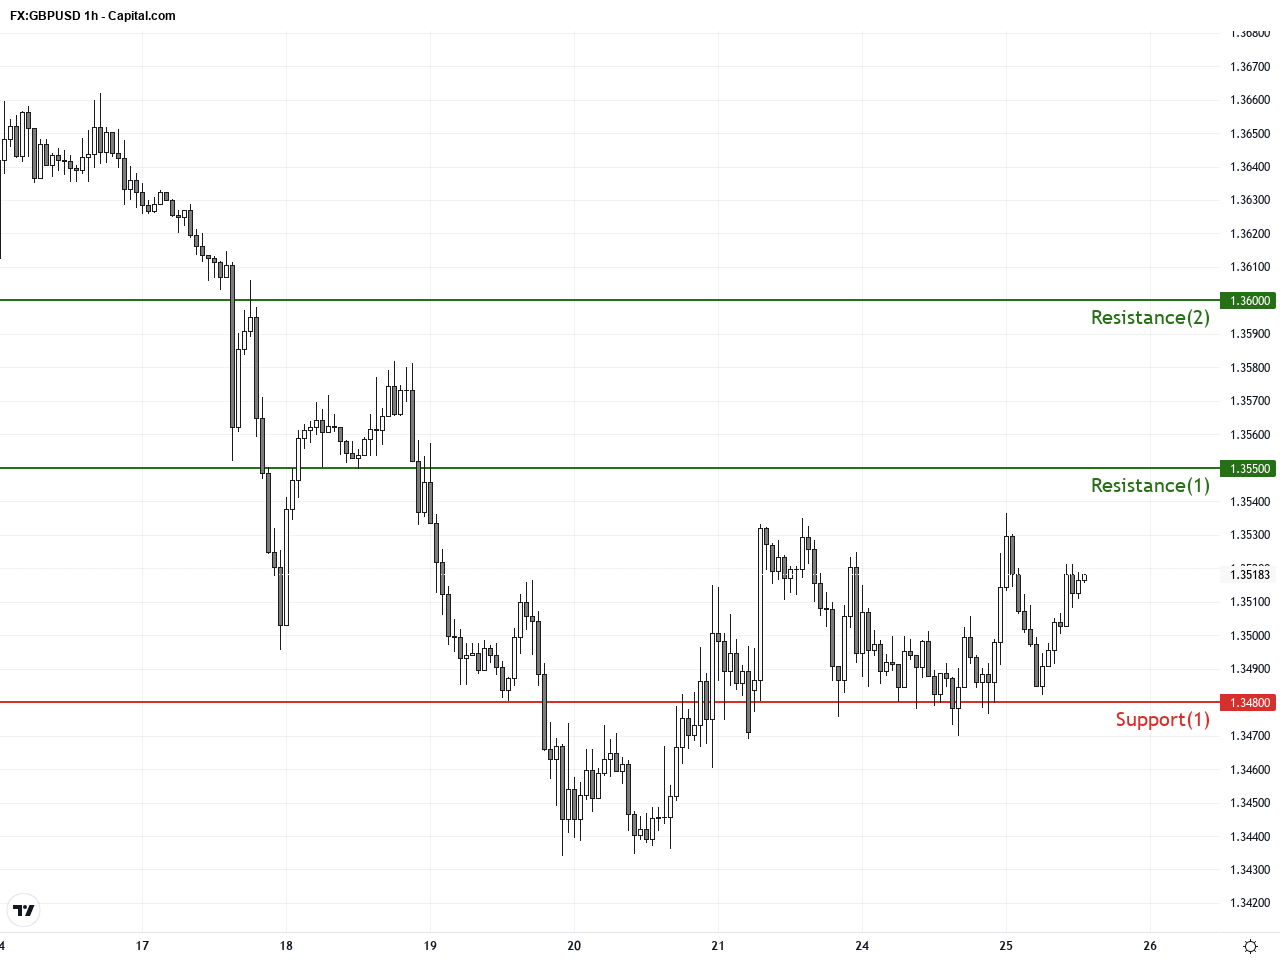
On the 1-hour chart, GBPUSD volatility has increased over the past 3-5 days. Price attempts to recover have repeatedly met resistance around 1.355, forming a notable resistance zone. Recently, a bearish engulfing candlestick appeared, indicating continued short-term selling pressure. Bollinger Bands have expanded following a period of contraction, suggesting that directional volatility may accelerate. The MACD remains below the zero line, indicating bearish momentum persisting. Overall, the technicals point to ongoing short-term downside risk that traders should be cautious about.
Technical Trend: Cautiously Bearish Trend
The key technical insight is GBPUSD’s break below the ascending trendline, signaling a potential trend reversal. The MACD bearish crossover along with price hovering near the lower Bollinger Band indicates increasing selling pressure. Both daily and hourly charts align to show a bearish bias in the short to medium term. The recent bearish engulfing pattern confirms seller dominance in the near term, with a likely test of yearly low support levels ahead. Traders should prepare for possible accelerated downside especially under continued US dollar strength.Today’s economic calendar does not contain any major events directly impacting GBPUSD. While various Eurozone and US data releases and speeches from officials are scheduled, these are mostly medium to low importance and unlikely to decisively affect the GBPUSD price in the short term. Traders should keep an eye on upcoming Bank of England officials’ testimonies, which could significantly influence market sentiment.
Resistance & Support
The above financial market data, quotes, charts, statistics, exchange rates, news, research, analysis, buy or sell ratings, financial education, and other information are for reference only. Before making any trades based on this information, you should consult independent professional advice to verify pricing data or obtain more detailed market information. 1uptick.com should not be regarded as soliciting any subscriber or visitor to execute any trade. You are solely responsible for all of your own trading decisions.