


 |
| Gold V.1.3.1 signal Telegram Channel (English) |

USDCAD: Dollar Faces Headwinds as Support Nears 1.3550 Key Technical Level
2026-02-10 @ 13:01
Over the past 24 to 48 hours, USD/CAD has shown relatively stable fluctuations, hovering close to yesterday’s closing price of 1.35557 with minor oscillations. Overall, the Canadian dollar demonstrated resilience supported by renewed foreign inflows, helping the pair to briefly halt its downward trend and post slight gains. Additionally, rising oil prices played a crucial role in boosting CAD, given Canada’s economic reliance on energy exports.
The latest market news highlights that the U.S. dollar came under pressure as China instructed banks to reduce holdings of U.S. Treasuries. Traders’ growing concerns over China’s continued reduction of dollar-denominated assets dampened demand for the greenback. This development weighed on the dollar against major currencies, including USD/CAD, reflecting doubts on the dollar’s fundamentals.
For the average investor, this means the dollar’s international appeal faces near-term challenges, while the Canadian dollar benefits from stronger energy prices and foreign interest. Forex traders or investors looking at this currency pair should closely monitor U.S.-China financial relations and oil price trends, as these have been the main drivers behind recent market moves and price shifts.
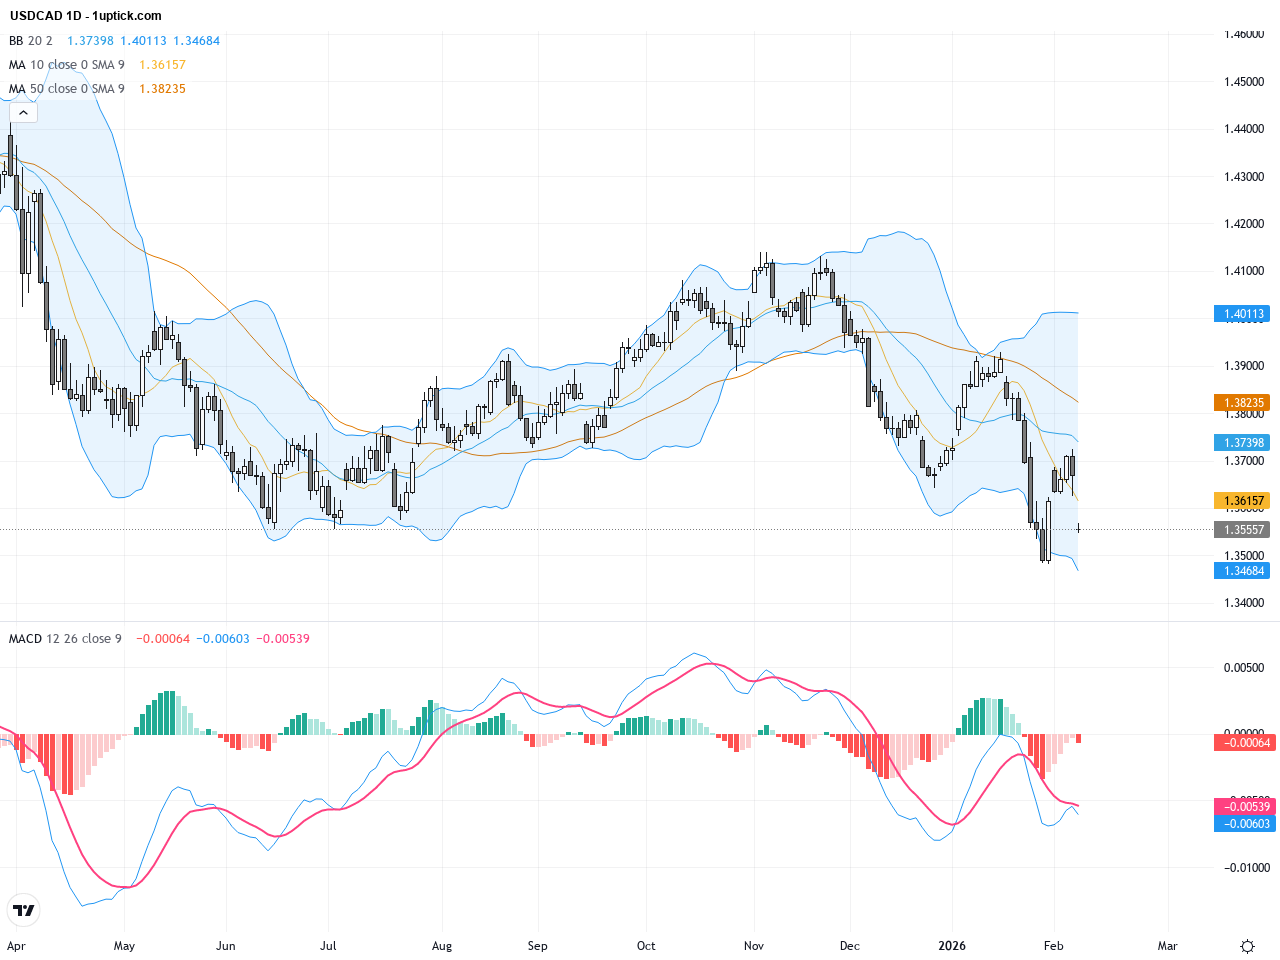
The daily chart shows USDCAD gradually declining from recent highs, with prices trading below the 50-day and 200-day moving averages, indicating a medium-to-long-term bearish trend. Bollinger Bands are widening, signaling increased volatility. The MACD remains below the zero line, confirming sustained downside momentum. The pair has formed a clear downtrend over the past 10 days, recently testing the 1.3550 support level without strong reversal signals, highlighting persistent selling pressure.
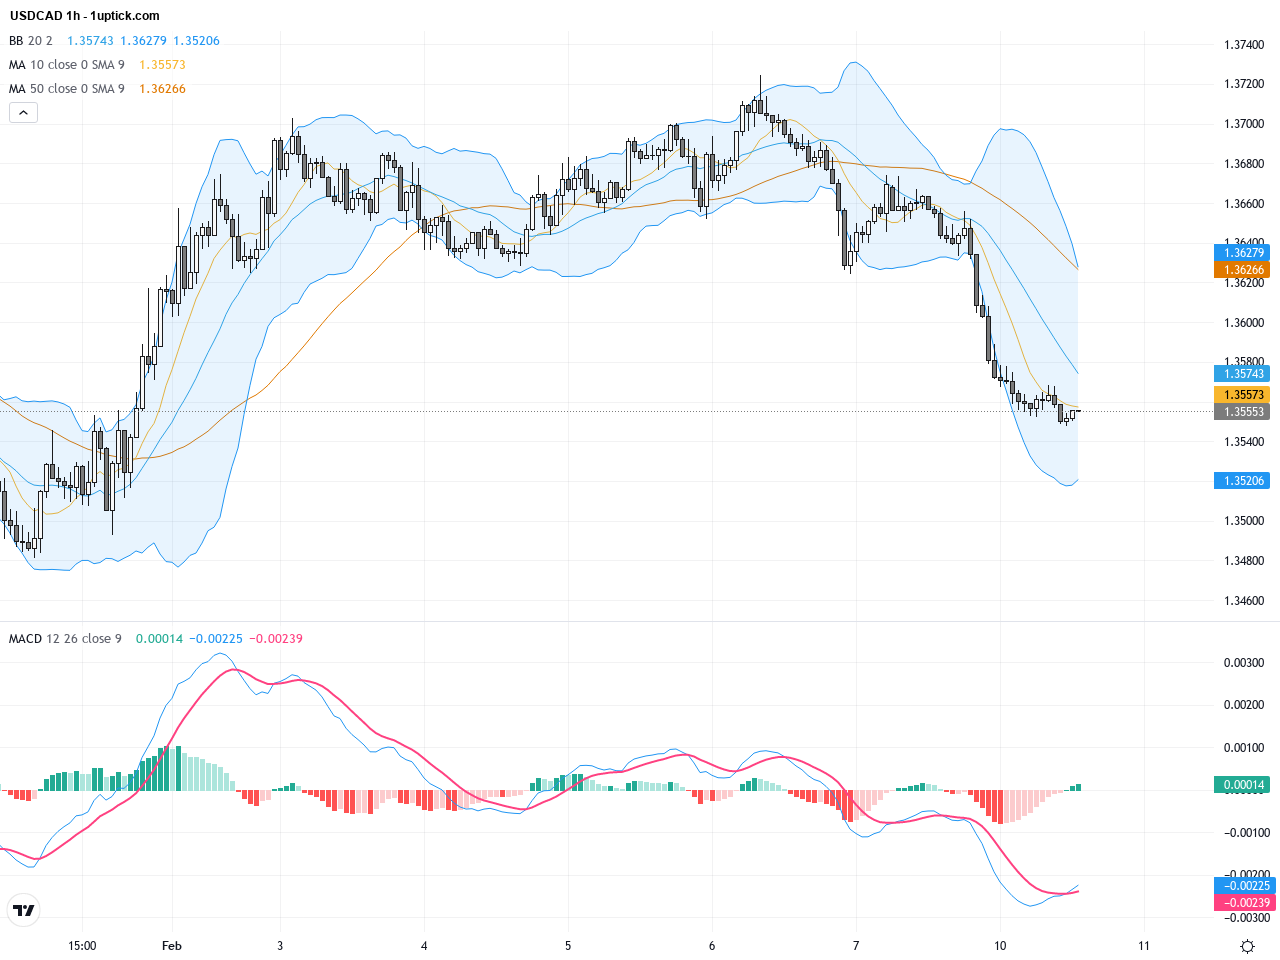
On the hourly chart, USDCAD has traded in a volatile range of 1.3530–1.3570 over the last 3-5 days. Prices fluctuate around short-term moving averages, with Bollinger Bands remaining wide, highlighting potential for a breakout. The MACD has shown a bearish crossover recently, confirming short-term selling pressure. However, a hammer candlestick with a long lower wick formed during yesterday’s trading session suggests a possible short-term bounce near critical support.
Technical Trend: Cautiously bearish with volatile sideways movements.
Technically, USDCAD shows continued downside pressure on the daily chart, supported by a bearish MACD crossover and Bollinger Band expansion. However, the recent hourly hammer candlestick near 1.3550 support hints at a possible short-lived rebound. This suggests a cautious approach with potential to capitalize on small retracements while protecting downside risk with prudent stop losses.No major economic events directly impacting USDCAD are scheduled for today. However, key U.S. data releases on retail sales and import/export prices are due around 13:30 HKT and onwards. Stronger-than-expected data could provide the USD with a temporary boost, possibly halting the recent decline. Alternatively, weaker figures may extend downward pressure on the pair. Traders should monitor these releases closely to adjust positions accordingly.
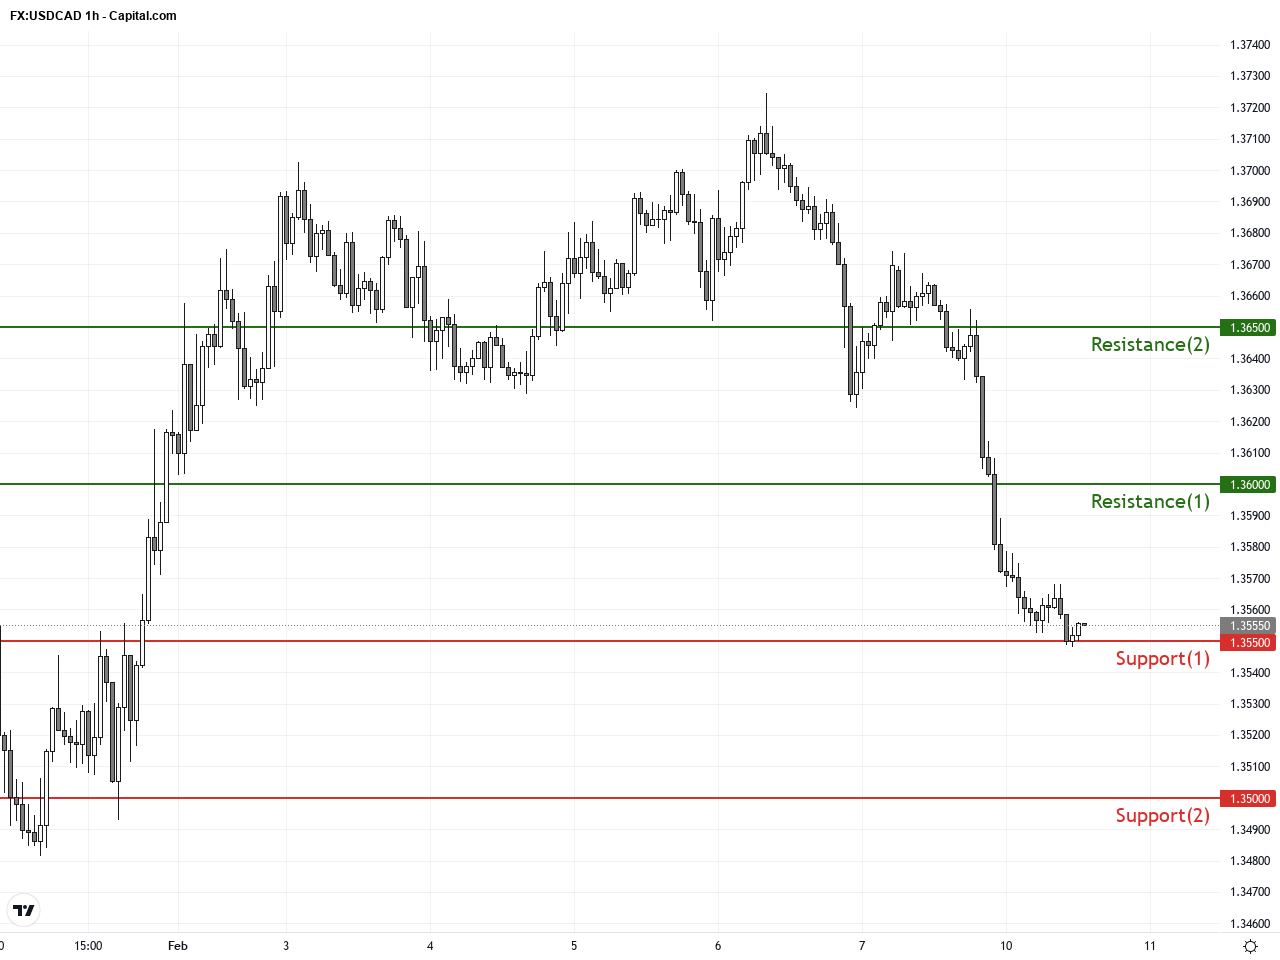
Resistance & Support
The above financial market data, quotes, charts, statistics, exchange rates, news, research, analysis, buy or sell ratings, financial education, and other information are for reference only. Before making any trades based on this information, you should consult independent professional advice to verify pricing data or obtain more detailed market information. 1uptick.com should not be regarded as soliciting any subscriber or visitor to execute any trade. You are solely responsible for all of your own trading decisions.
Latest Technical Analysis
Latest Insightz