


 |
| Gold V.1.3.1 signal Telegram Channel (English) |

USDCAD: Key Resistance at 1.3728 Triangle Formation Signals Major Breakout Potential
2026-02-26 @ 13:03
Over the past 24 to 48 hours, the USD/CAD pair exhibited notable volatility, closing near the 1.3670 mark, nearly unchanged from yesterday’s close at 1.36705. The broader market mood was heavily influenced by the performance of the U.S. Dollar Index and the recent U.S. political developments. The Dollar Index faced strong resistance near the 98.00 level and pulled back to around 97.70, directly impacting the USD/CAD’s price movements.
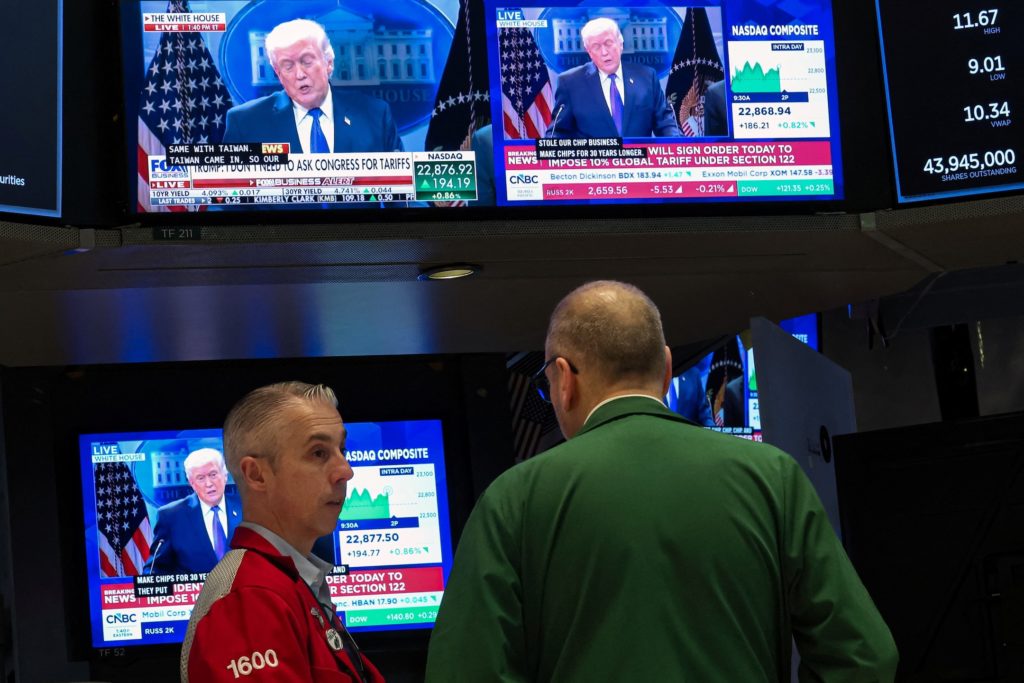
Market expectations pinned on President Trump’s State of the Union speech were ultimately unmet, as the event turned out to be a non-factor for the markets, failing to provide clear policy direction or boost the U.S. dollar further. This shift increased risk appetite in markets generally, causing some pullback in the USD/CAD pair. At the same time, oil prices remained well-supported, benefiting the Canadian dollar given Canada’s status as a major oil exporter. Coupled with a softer U.S. trade stance, these factors capped gains for the USD/CAD currency pair.
In simple terms for everyday investors, the recent USD/CAD movement reflects a weaker U.S. dollar grappling with domestic political uncertainty and growing global risk appetite, while a steady oil market supports the Canadian dollar. As a result, the pair remains range-bound between approximately 1.36 and 1.37 in the short term. Moving forward, investors should watch upcoming U.S. economic data releases and oil price trends, as these will be key drivers for the next directional move in the USD/CAD.
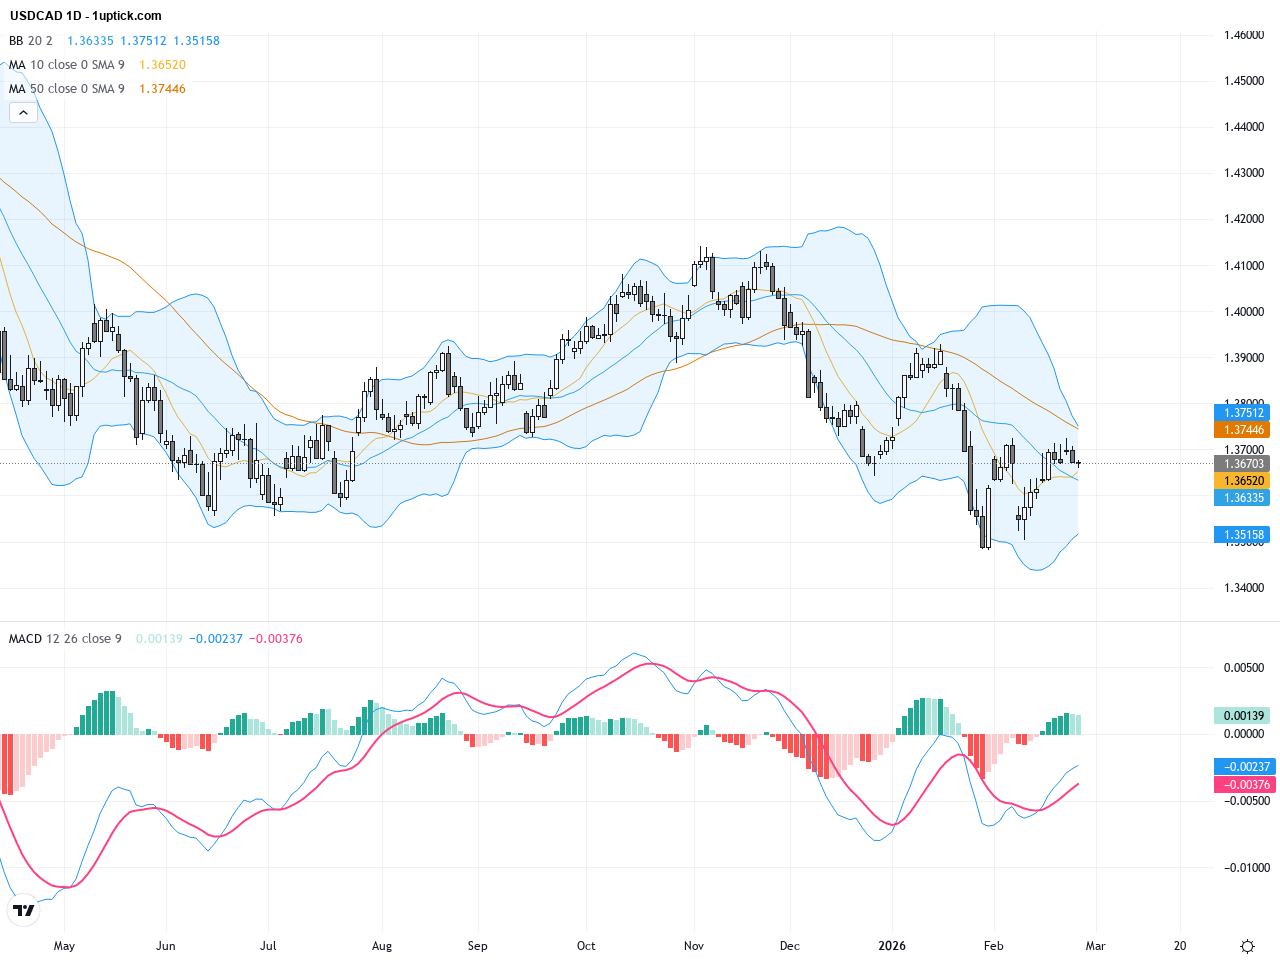
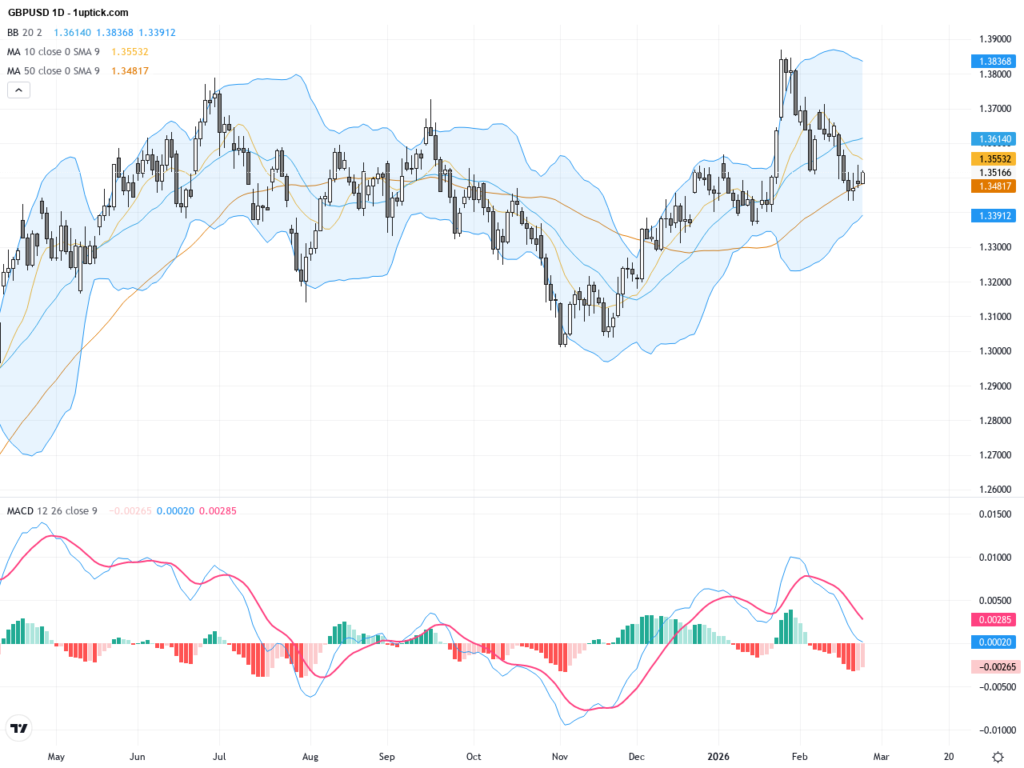
The daily chart reveals a mild uptrend since early February with USDCAD consolidating below the 50-day SMA at 1.37188 and the 200-day SMA at 1.38302. Bollinger Bands have narrowed, indicating reducing volatility, and the MACD hovers near the zero line, signaling balanced momentum. Since mid-February, prices have formed a triangle consolidation between 1.3650 and 1.3730, suggesting an imminent directional breakout. Medium to long-term indicators remain neutral to bullish.
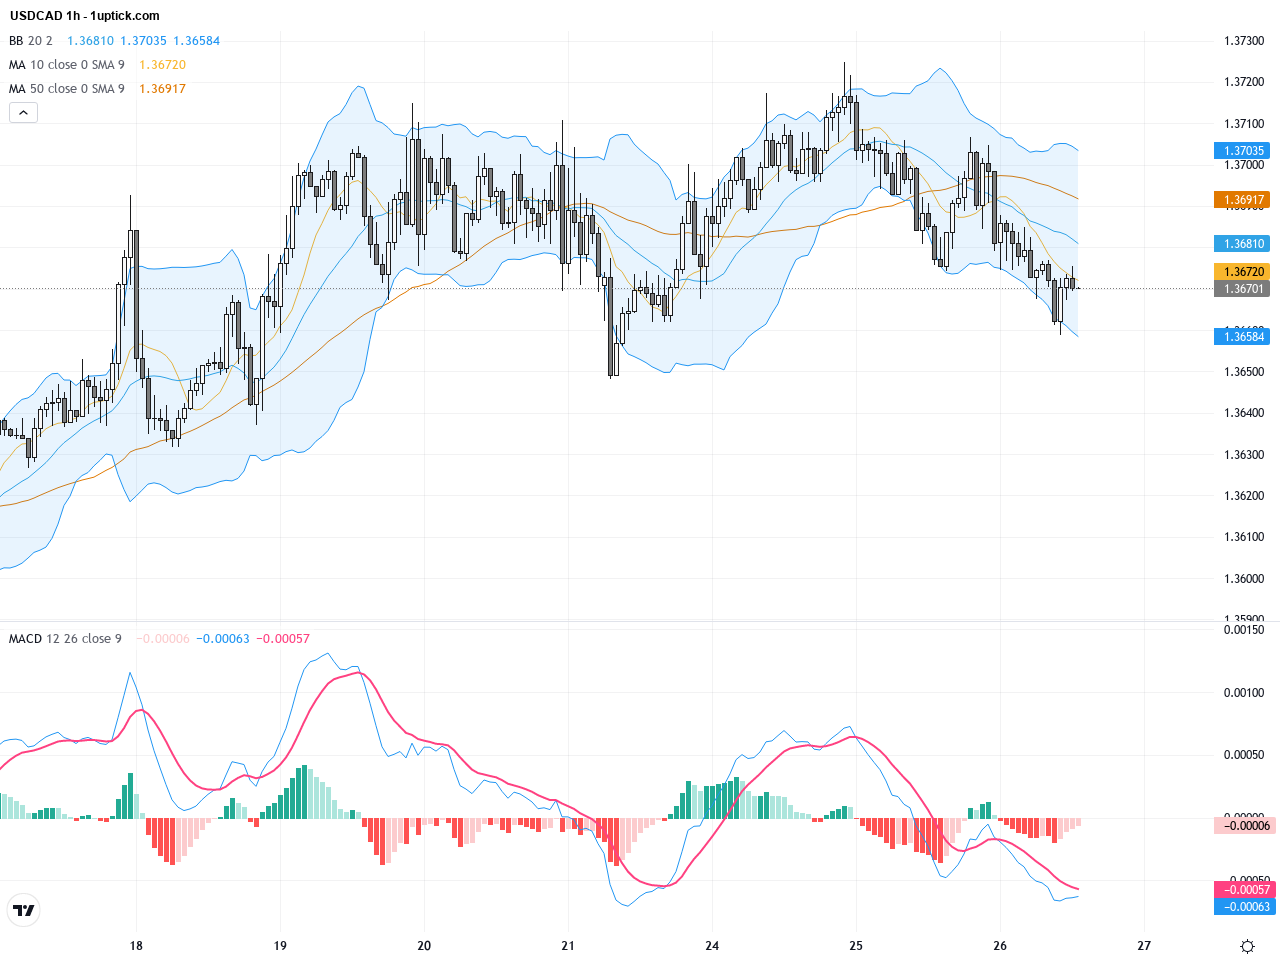
The 1-hour chart over the last 5 days shows heightened volatility with increasing volume near key levels between 1.3700 and 1.3728. Short-term moving averages portray bullish alignment, notably the 20 EMA acting as dynamic support. The MACD signaled a bullish crossover recently, indicating strengthened short-term momentum. However, the price is near the upper Bollinger Band, hinting at a potential pullback. The recent bearish engulfing candle suggests possible intra-day correction, with 1.3670 support critical to hold.
Technical Trend: USDCAD is currently in a cautiously bullish consolidation phase, showing mild upward momentum with an overall trend cautiously tilted towards the bulls.
USDCAD’s key technical highlight is the daily triangle consolidation nearing critical resistance at 1.3728. A breakout here could trigger strong bullish momentum. MACD is strengthening and hourly charts show improving short-term momentum, signaling increased upside potential. However, the bearish engulfing candle warns of a possible short-term retracement. Traders should closely watch volume and the 1.3670 support level to spot high-probability trading setups.Today’s GMT+1 economic events offer limited direct impact for USDCAD. The Canadian current account data at 14:30, with forecasts improving from -9.68B CAD to -7.9B CAD, may strengthen the Canadian Dollar if better than expected. Conversely, the US weekly jobless claims and remarks from several FOMC members later today could influence the US dollar’s sentiment and thus impact USDCAD’s short-term movement. Traders should monitor these data and commentary closely.
Resistance & Support

The above financial market data, quotes, charts, statistics, exchange rates, news, research, analysis, buy or sell ratings, financial education, and other information are for reference only. Before making any trades based on this information, you should consult independent professional advice to verify pricing data or obtain more detailed market information. 1uptick.com should not be regarded as soliciting any subscriber or visitor to execute any trade. You are solely responsible for all of your own trading decisions.