


 |
| Gold V.1.3.1 signal Telegram Channel (English) |
USDCAD Technical & Fundamental Analysis: Slowing Fed Rate Cut Pace Boosts USD/CAD Rally
2026-02-05 @ 13:01
Over the past 24 to 48 hours, the USD/CAD currency pair displayed a noticeable upward trend, climbing from yesterday’s closing price of 1.3683 to levels approaching 1.3700. This rise was primarily driven by the market’s growing expectation that the Federal Reserve’s pace of potential rate cuts is slowing, which has bolstered the U.S. dollar.
Multiple market developments converged to strengthen the dollar, including weaker-than-expected ISM service sector data in the U.S. and similarly soft Canadian services data, which weighed on the loonie. Meanwhile, escalating geopolitical tensions between the U.S. and Iran have also supported demand for the safe-haven dollar. Despite a modest rebound in oil prices, closely linked to the Canadian dollar, the boost was insufficient to counter the loonie’s weakness, further pushing USD/CAD higher.
For an average investor, this dollar strength against the Canadian dollar reflects uncertainty around the timing of U.S. interest rate adjustments—slower Fed rate cuts imply the dollar may remain robust longer. This environment gives confidence to holders of dollar assets, while the Canadian dollar faces pressure due to weaker economic data and oil price volatility, prompting traders to be more cautious.
Overall, the short-term performance of USD/CAD remains tightly connected to Fed policy expectations. Investors will want to closely monitor upcoming U.S. employment and inflation reports, as these will continue to influence the relative strength between the U.S. dollar and Canadian dollar.

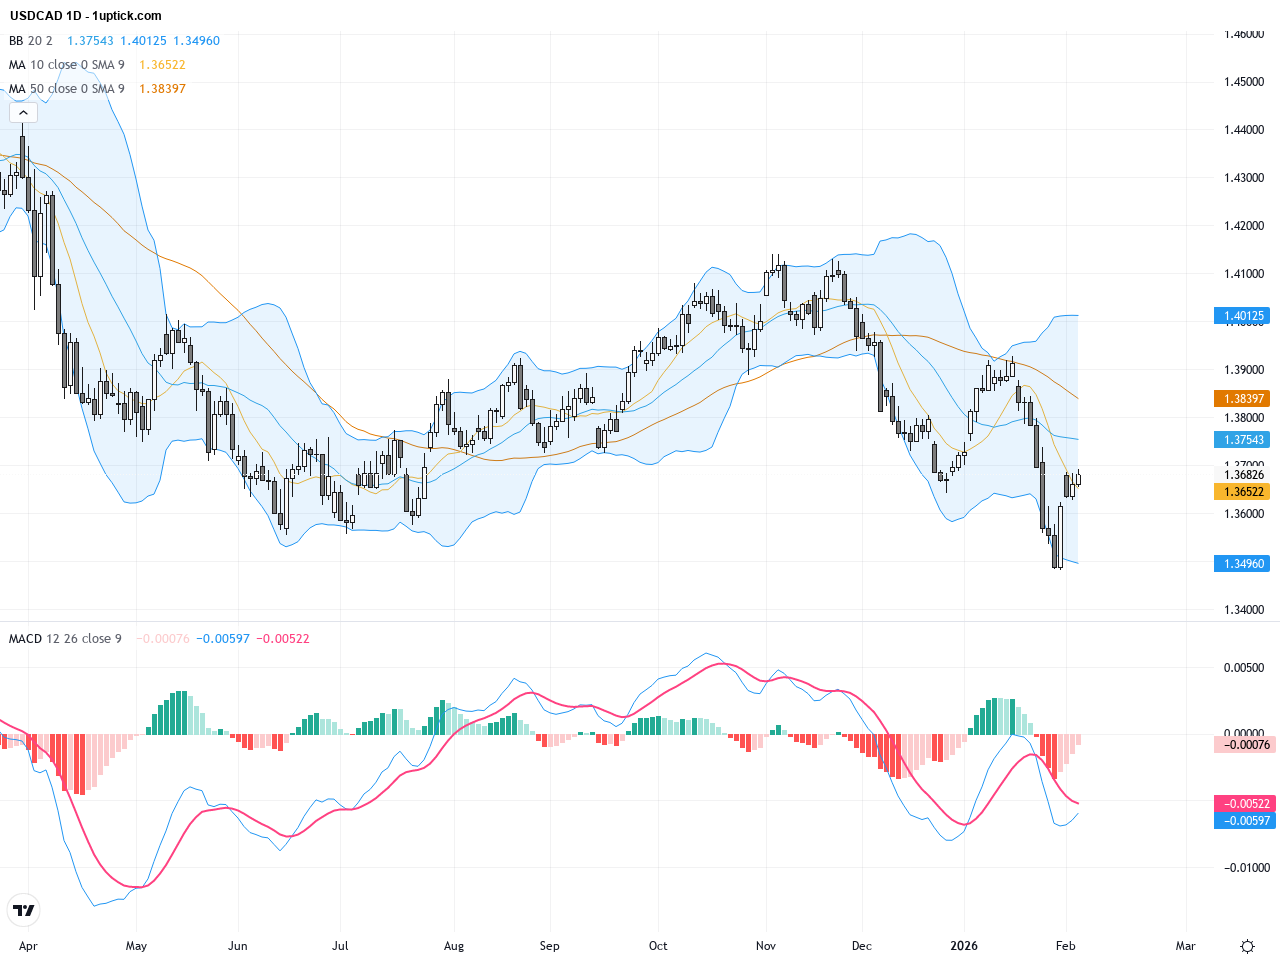
The daily chart shows a gradual upward progression for USDCAD, with prices currently trading below the 200-day moving average (~1.3832) and 50-day moving average (~1.3758), indicating a medium-term consolidation phase. The tightening Bollinger Bands suggest reduced volatility, while the MACD is forming a bullish crossover signaling increasing short-term momentum. Overall, the trend is neutral to slightly bullish, but caution is warranted near the 200-day MA resistance.

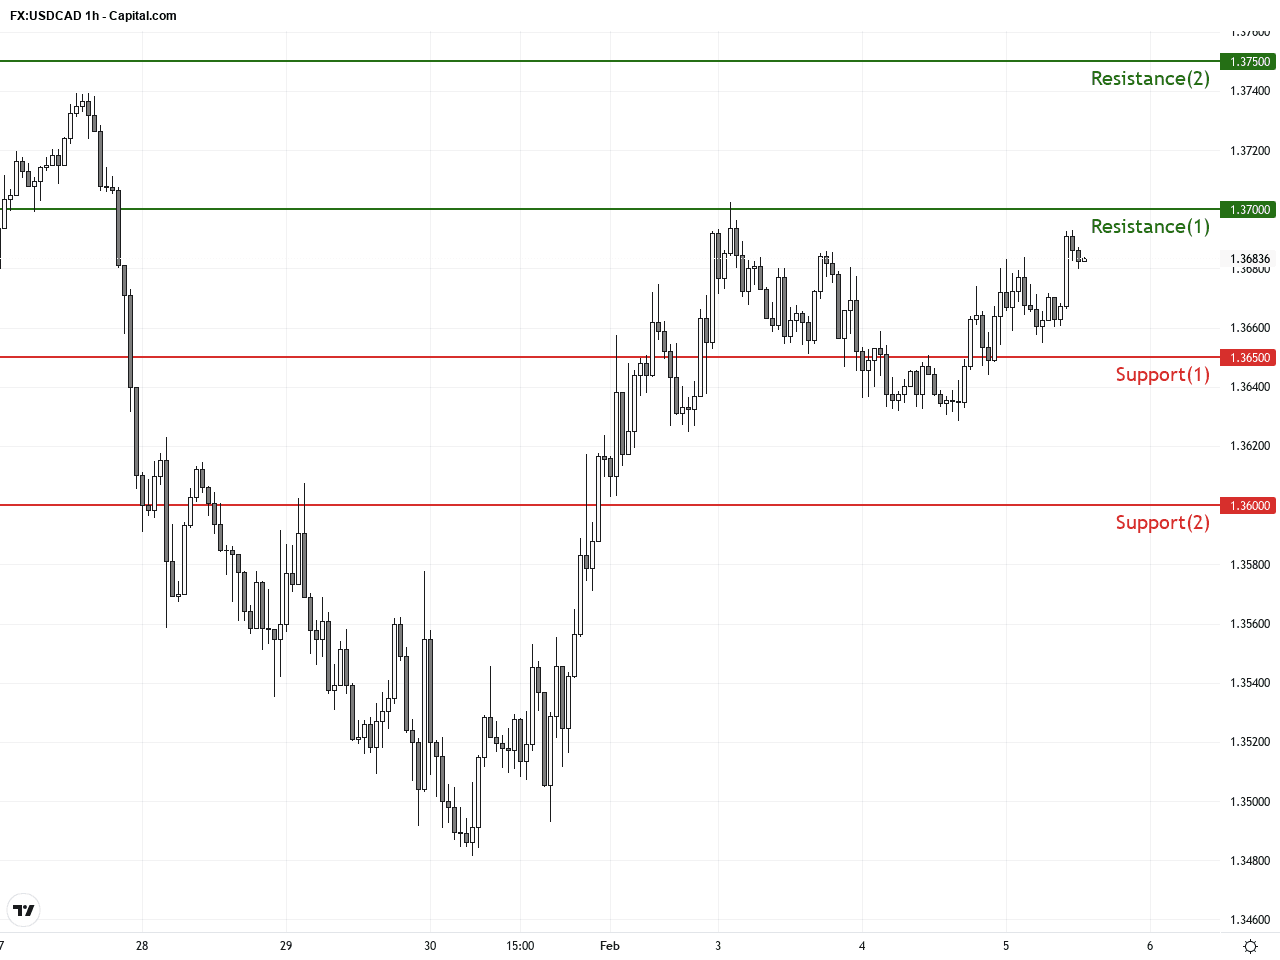
On the hourly chart, USDCAD has climbed from roughly 1.3620 to above 1.3680, trading near the middle of the Bollinger Bands and approaching the upper band. The MACD is above its signal line in bullish territory, and the RSI is near 70, indicating potential mild overbought conditions but strong upward momentum. An ascending flag pattern has emerged recently; a break above 1.37 resistance could target 1.3750 in the near term.
Technical Trend: A cautiously optimistic mix of bullish and consolidation price action, indicating a tentative upward trend.
Technically, USDCAD is forming a critical ascending flag pattern supported by a bullish MACD crossover, strengthening short-term buying momentum. The daily Bollinger Bands’ contraction indicates the market is awaiting a directional breakout. A decisive move above 1.37 could trigger another leg higher, while failure to breach may lead to a pullback toward 1.3600 support. Traders should monitor volume and upcoming US labor market reports as strong indicators of trend continuation.Today’s economic calendar features no major events directly impacting USDCAD. Speeches by FOMC members and Canadian central bank officials are scheduled later in the session. For now, market focus remains on forthcoming US employment data and commodity price movements. With policy rates stable in both countries, short-term price moves are likely driven by technical setups and broader macro factors.
Resistance & Support
The above financial market data, quotes, charts, statistics, exchange rates, news, research, analysis, buy or sell ratings, financial education, and other information are for reference only. Before making any trades based on this information, you should consult independent professional advice to verify pricing data or obtain more detailed market information. 1uptick.com should not be regarded as soliciting any subscriber or visitor to execute any trade. You are solely responsible for all of your own trading decisions.