


 |
| Gold V.1.3.1 signal Telegram Channel (English) |

USDCAD: USD Strength Breaks Key 1.3600 Resistance on Strong US Jobs Data
2026-02-12 @ 13:01
Over the past 24 to 48 hours, the USD/CAD pair experienced mild gains, stabilizing around 1.3580, slightly above yesterday’s closing price of 1.3583. The standout driver was the strong U.S. Non-Farm Payroll (NFP) data, which bolstered the U.S. Dollar broadly. This strengthened dollar put pressure on the Canadian Dollar, causing the USD/CAD to hover just below the key 1.3600 level.
Specifically, the better-than-expected U.S. employment figures raised market expectations that the Federal Reserve would maintain a tight monetary policy stance longer than previously anticipated, sharply reducing hopes for rate cuts. This development weighed on the resource-dependent Canadian Dollar, especially amid emerging concerns about potential U.S. withdrawal from the US-Mexico-Canada Agreement (USMCA). The combination of robust U.S. labor data and trade uncertainties has thus driven a weaker CAD relative to the USD.
For the average investor, this translates into heightened volatility for assets linked to the Canadian Dollar and potential shifts in cross-border trade costs. Those holding Canadian Dollar-denominated assets or engaging in Canadian market activities should closely monitor upcoming U.S. economic reports and trade negotiations. The rally in the U.S. Dollar suggests ongoing challenges for the CAD, reflecting broader macroeconomic and geopolitical uncertainties shaping the market landscape.
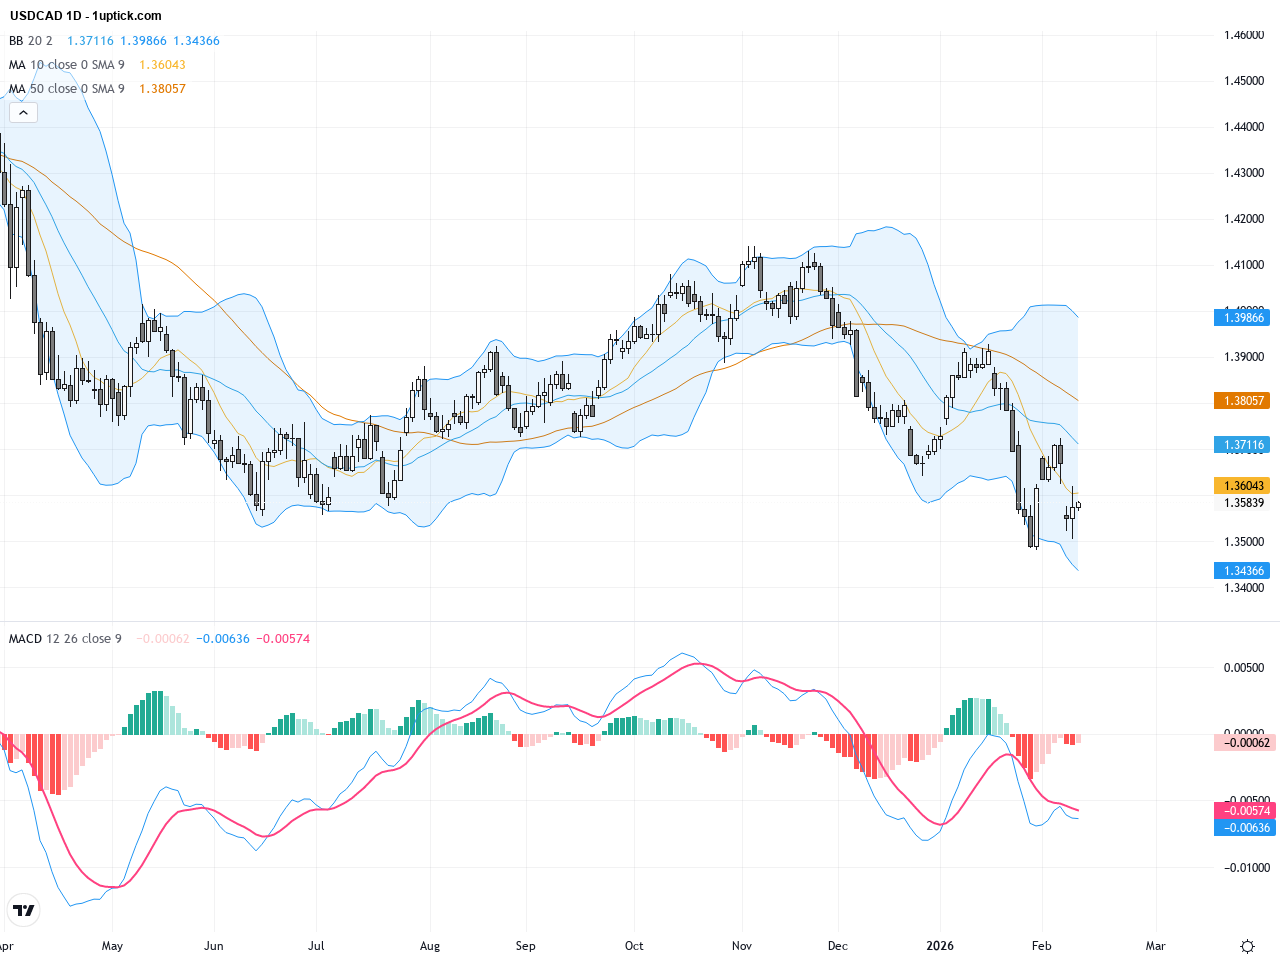
The daily chart reveals that USDCAD has formed a phase bottom over recent months with a gradual recovery trend. Price is approaching the 200-day moving average, suggesting medium-term upside potential. The Bollinger Bands are contracting, indicating a possible breakout following consolidation. The MACD shows increasing bullish momentum, with expanding histogram bars supporting further upward movement. Overall, the daily chart signals a strengthening trend and an improving market sentiment.
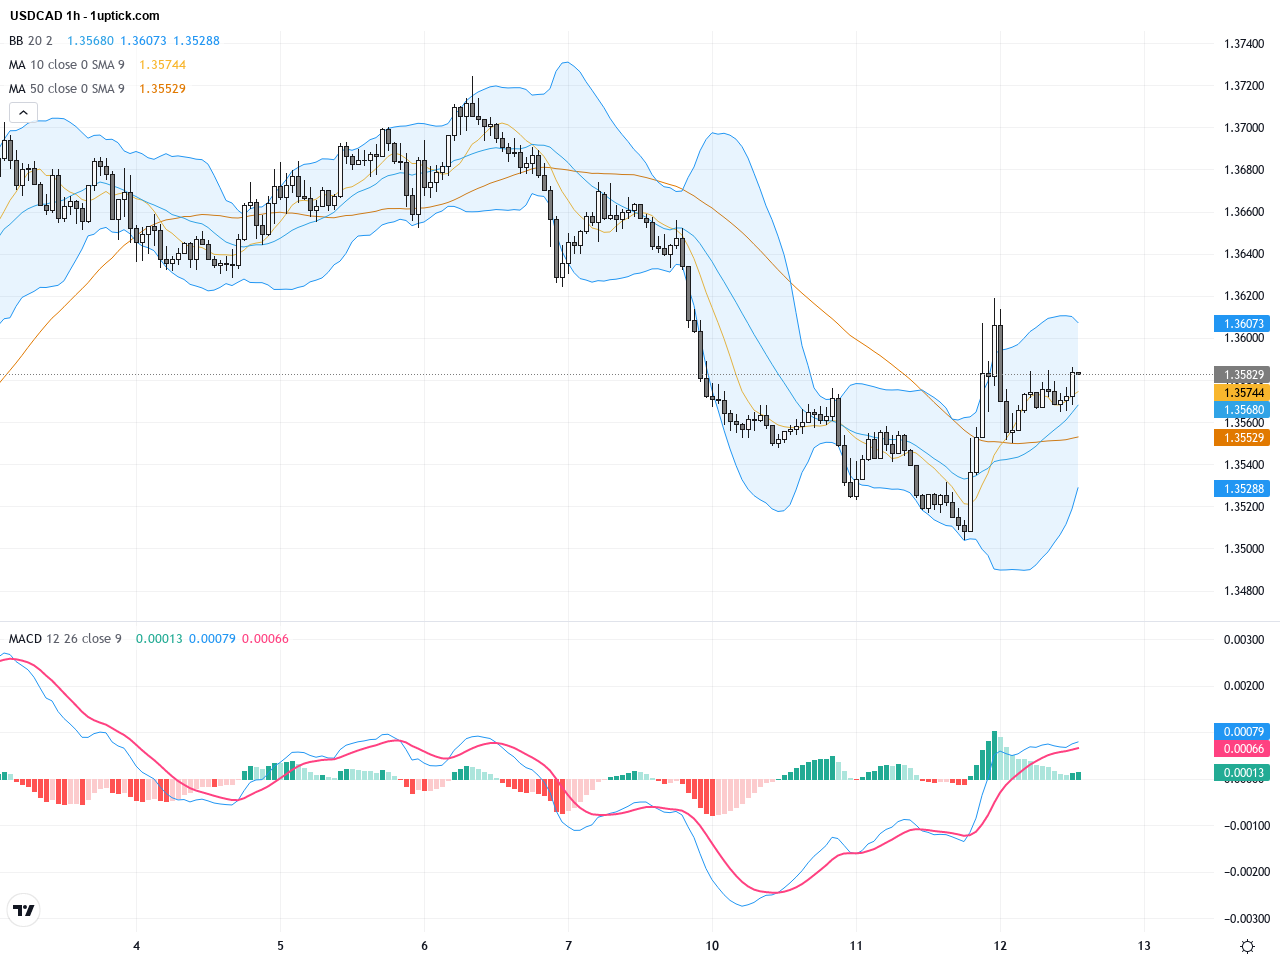
On the hourly chart covering the past 3-5 days, USDCAD displays a clear short-term uptrend. Price has broken out from a small symmetrical triangle pattern and is trading above the 20-period moving average. Bollinger Bands have widened upwards, indicating rising volatility. A recent bullish engulfing candlestick pattern confirms buying strength. The MACD has formed a golden cross, providing a solid entry signal. The pair is likely to continue gaining in the near term under positive momentum.
Technical Trend: Trend Assessment: Cautiously Bullish
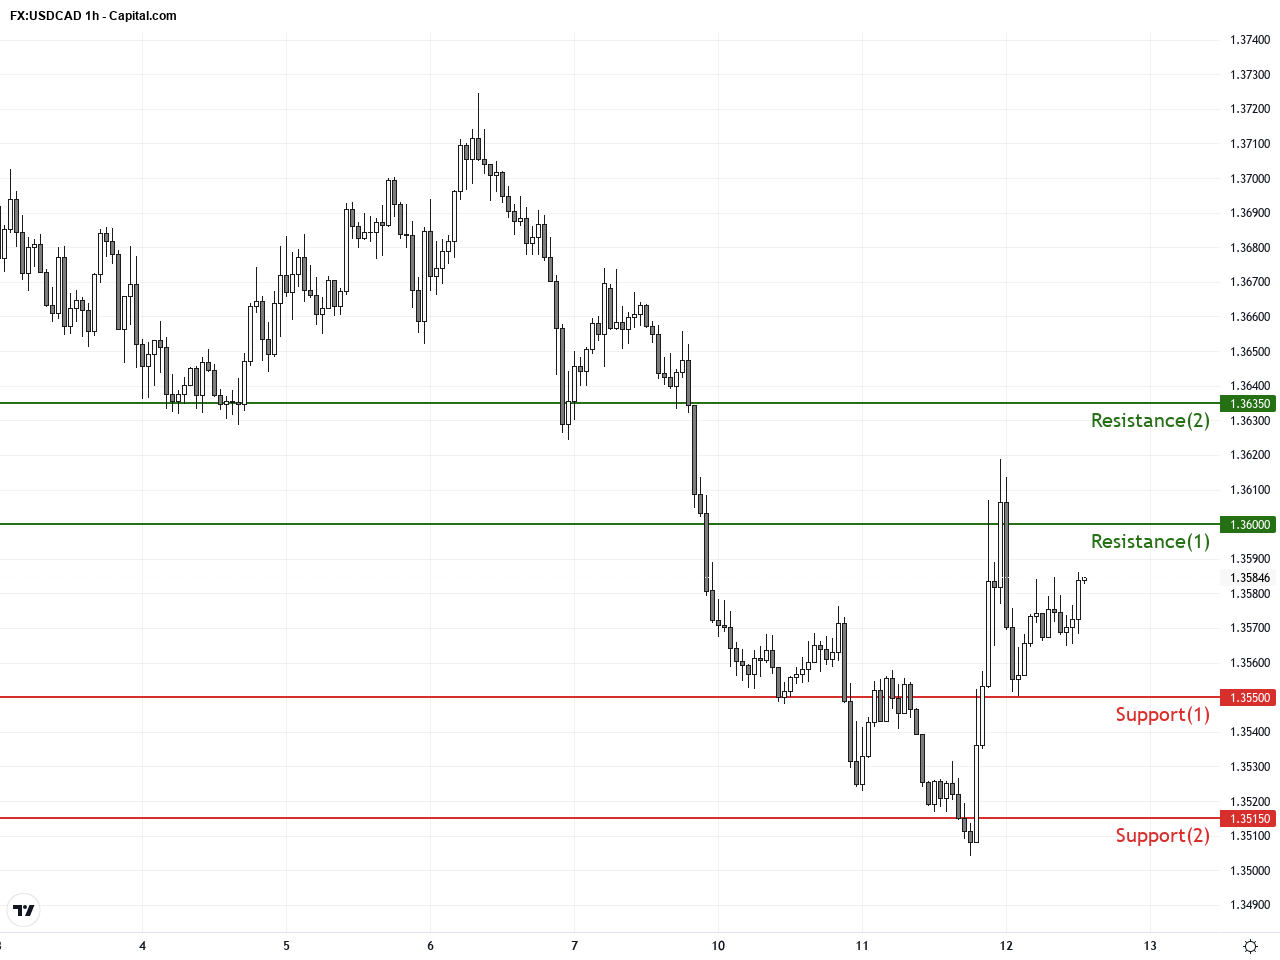
Technically, USDCAD is confirming an upward trend on both daily and hourly timeframes. The hourly bullish engulfing pattern combined with a MACD golden cross signals strong short-term bullish momentum. A break above the 1.3600 resistance level could pave the way for further gains. However, failure to hold the 20-period moving average support may bring short-term pullbacks. Increasing trading volume adds credibility to the current move. Overall, technical patterns favor a bullish stance in the short term.Today’s GMT+1 economic calendar holds no significant events directly impacting USDCAD. UK and China releases are scheduled but hold limited relevance to USD/CAD. US weekly jobless claims and existing home sales data are expected after 21:30 HKT. A better-than-expected unemployment claim figure would be positive for the US Dollar and could fuel further USDCAD gains. Traders should monitor these releases closely for potential market moves.
Resistance & Support
The above financial market data, quotes, charts, statistics, exchange rates, news, research, analysis, buy or sell ratings, financial education, and other information are for reference only. Before making any trades based on this information, you should consult independent professional advice to verify pricing data or obtain more detailed market information. 1uptick.com should not be regarded as soliciting any subscriber or visitor to execute any trade. You are solely responsible for all of your own trading decisions.