


 |
| Gold V.1.3.1 signal Telegram Channel (English) |
USDJPY: Bullish Breakout Above 155 Support Signals Strong Uptrend
2026-02-25 @ 11:02
Over the past 24 to 48 hours, the USD/JPY exchange rate experienced notable volatility. After dipping below yesterday’s closing price of approximately 155.46, the pair quickly rebounded, reaching highs above 156 during intraday trading. The US dollar was supported by strong US economic data and a weakening yen, pushing the exchange rate to recent highs. This movement highlights a resurgence of dollar bullishness, in stark contrast to the static closing figures observed yesterday.
The surge was primarily fueled by hawkish signals from the Federal Open Market Committee (FOMC) minutes, which bolstered market optimism for sustained dollar strength, particularly against the yen. The Bank of Japan’s softened rate hike expectations, paired with robust US economic indicators and strong consumer confidence, added downward pressure to the yen. Meanwhile, uncertainty surrounding an upcoming speech by US President Trump further stirred market fluctuations as investors anticipate potential impacts on trade policy.
For the average investor, this period of back-and-forth movement resembles a contest between two teams with shifting momentum: strong US economic data and policy moves continuously pushing the dollar higher, while the Bank of Japan maintains a defensive stance, limiting yen strength. If you hold assets linked to the dollar or yen, staying alert to economic data and policy announcements is crucial, as these factors directly influence exchange rate trends and portfolio value.

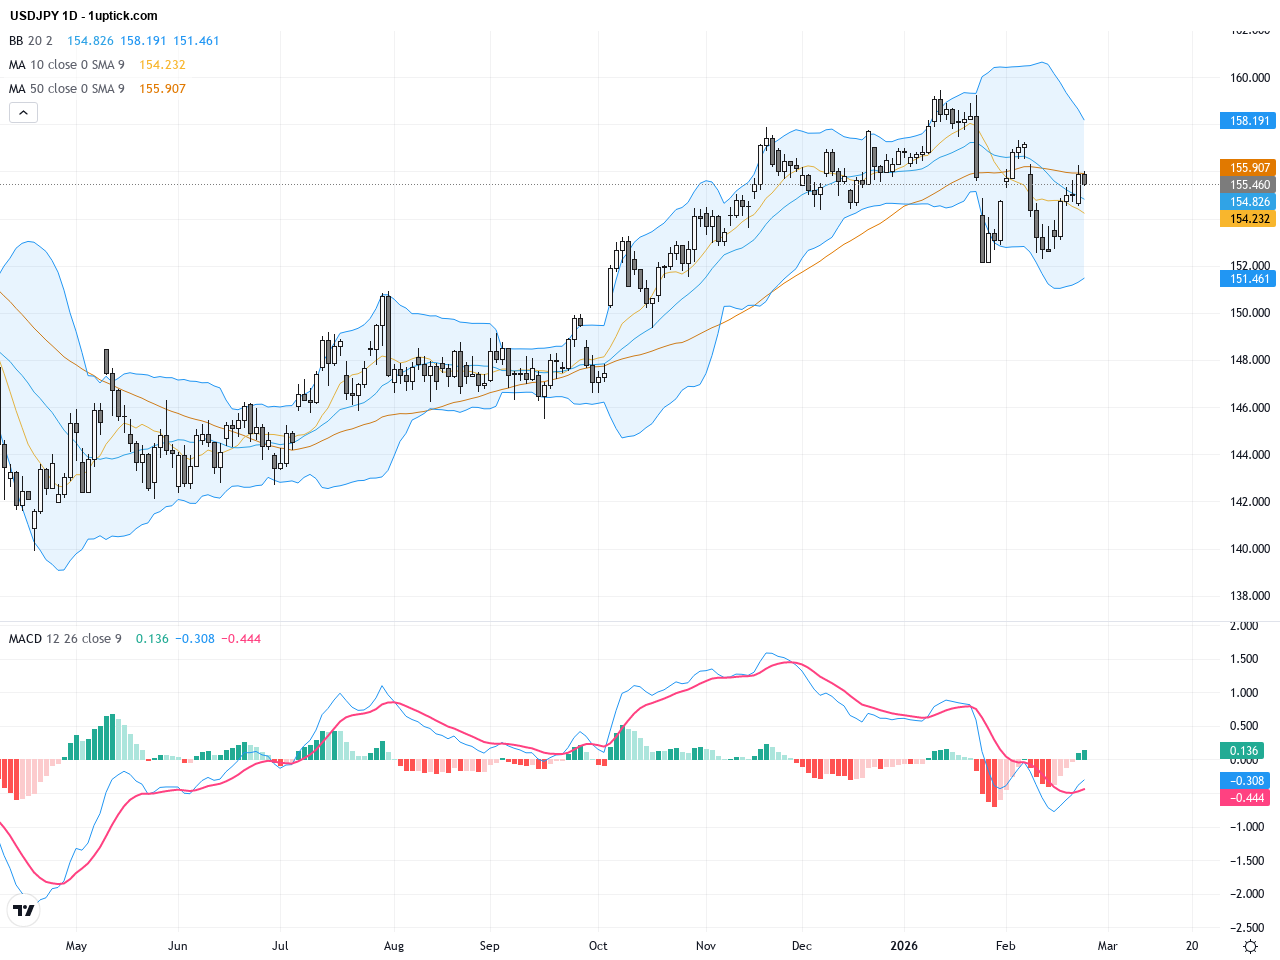
The USDJPY daily chart shows a steady uptrend since mid-February with spot price firmly above the 150-day moving average (~150.6). An ascending triangle breakout pattern has formed and price consolidation around the 155 region continues. Bollinger Bands are widening, signaling heightened volatility. The MACD indicator is in a bullish alignment, with positive divergence between the fast and slow lines, confirming strong upward momentum. Overall, the chart supports sustained bullish pressure and a likely breakout above the 156.00 resistance in the near term.
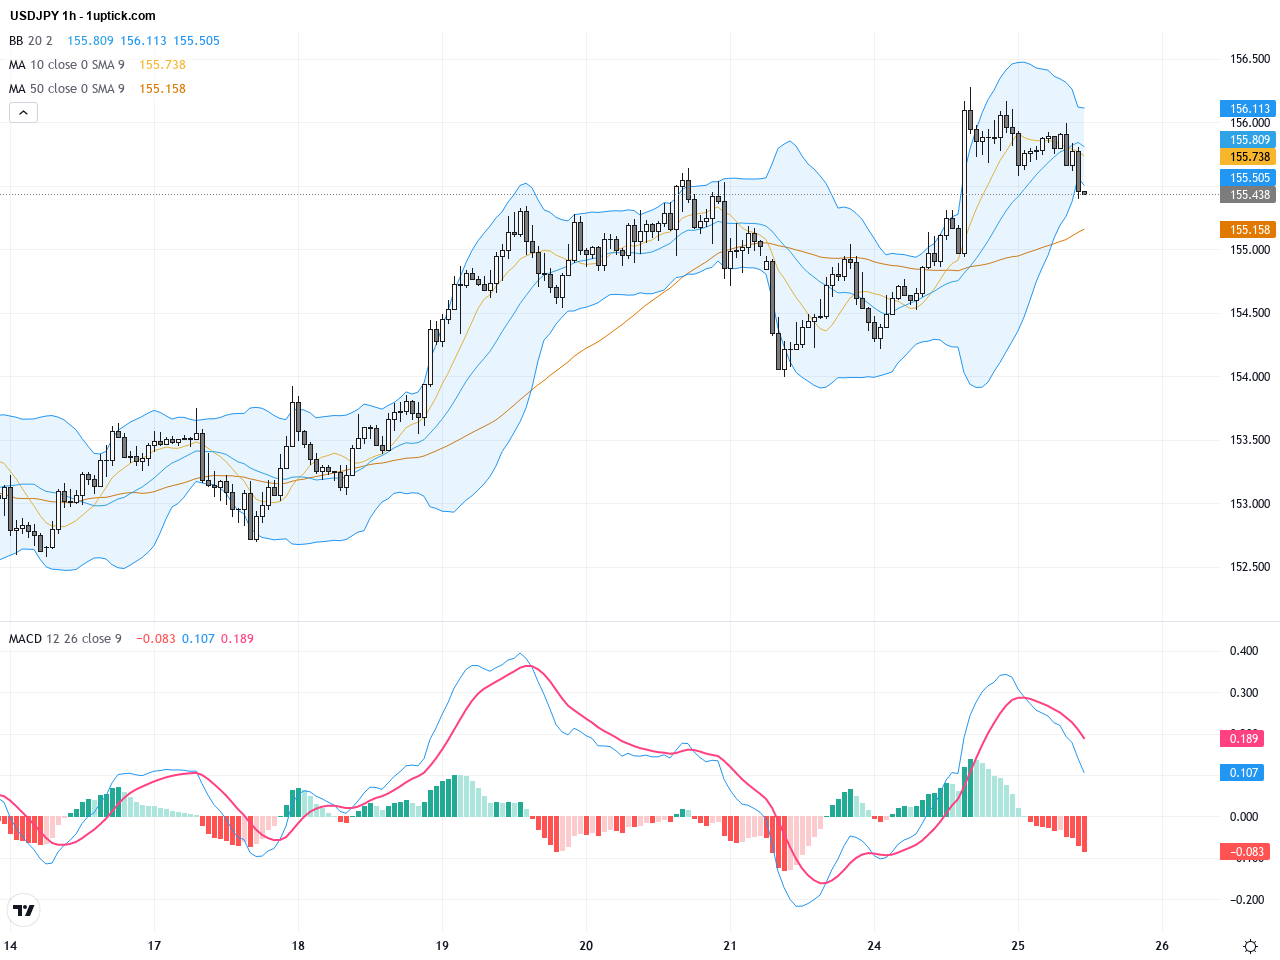
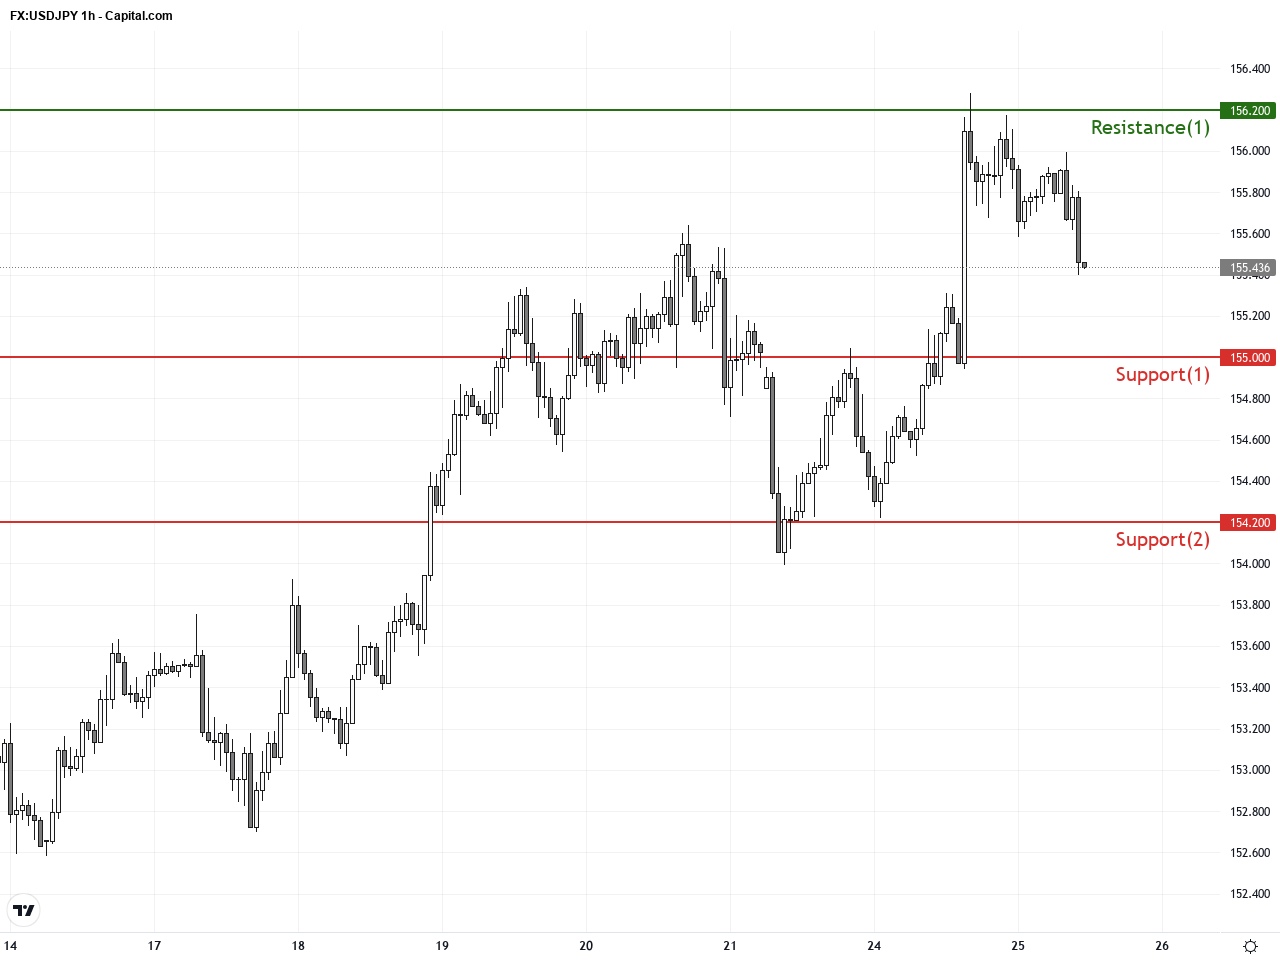
The hourly chart for USDJPY over the past 3-5 days displays strong bullish momentum. Price action steadily rides above the 20-period moving average and has broken out of the 155.10 to 155.40 consolidation range. Expanding Bollinger Bands and a burst above the middle band show rising short-term buying pressure. The MACD histogram turned positive, and a golden cross has formed between the MACD lines. Recent bullish engulfing candlesticks further reinforce the likelihood of continued upward movement with key resistance tests between 155.80 and 156.20 imminent.
Technical Trend: Decisively Bullish Trend
USDJPY has broken out of recent consolidation, confirming an ascending bullish trend supported by strong momentum indicators including a MACD golden cross and daily ascending triangle pattern. Expanding Bollinger Bands suggest increasing volatility with potential for larger price swings ahead. With both technical and fundamental factors aligned bullishly, the key to maintain positions is the 155.00 support level acting as a robust floor for potential upward moves.Today’s economic calendar focuses on German GDP and US crude oil inventory data but contains no events directly impacting the Japanese yen. Although US Federal Reserve speeches and oil stock changes might indirectly influence the dollar’s strength, there are no scheduled data releases expected to cause significant volatility in USD/JPY today. Traders should watch for Fed officials’ speeches at 15:35 and 17:00 GMT+1 for potential clues on the US dollar direction.
Resistance & Support
The above financial market data, quotes, charts, statistics, exchange rates, news, research, analysis, buy or sell ratings, financial education, and other information are for reference only. Before making any trades based on this information, you should consult independent professional advice to verify pricing data or obtain more detailed market information. 1uptick.com should not be regarded as soliciting any subscriber or visitor to execute any trade. You are solely responsible for all of your own trading decisions.