


 |
| Gold V.1.3.1 signal Telegram Channel (English) |

USDJPY: Technical Indicators Signal Short-Term Downside Pressure Amid Rising Japanese Export Momentum
2026-02-18 @ 11:01
Over the past 24 to 48 hours, USD/JPY has shown notable volatility, with prices dropping closer to the 153 level from yesterday’s closing price of around 153.514. Recent robust Japanese export data has boosted expectations of a stronger yen, directly pressuring the USD/JPY exchange rate. The surge in Japanese exports has also shifted market bets toward potential Bank of Japan rate hikes, benefiting the yen further.
Meanwhile, shifting Fed policy expectations have delayed anticipated US rate cuts, which, combined with the yen’s strength driven by Japan’s improving economic fundamentals, have increased downside risks for USD/JPY. For investors, this means USD/JPY could face continued pressure in the short term as the market prices in Japan’s growth momentum and rising odds of BoJ tightening.
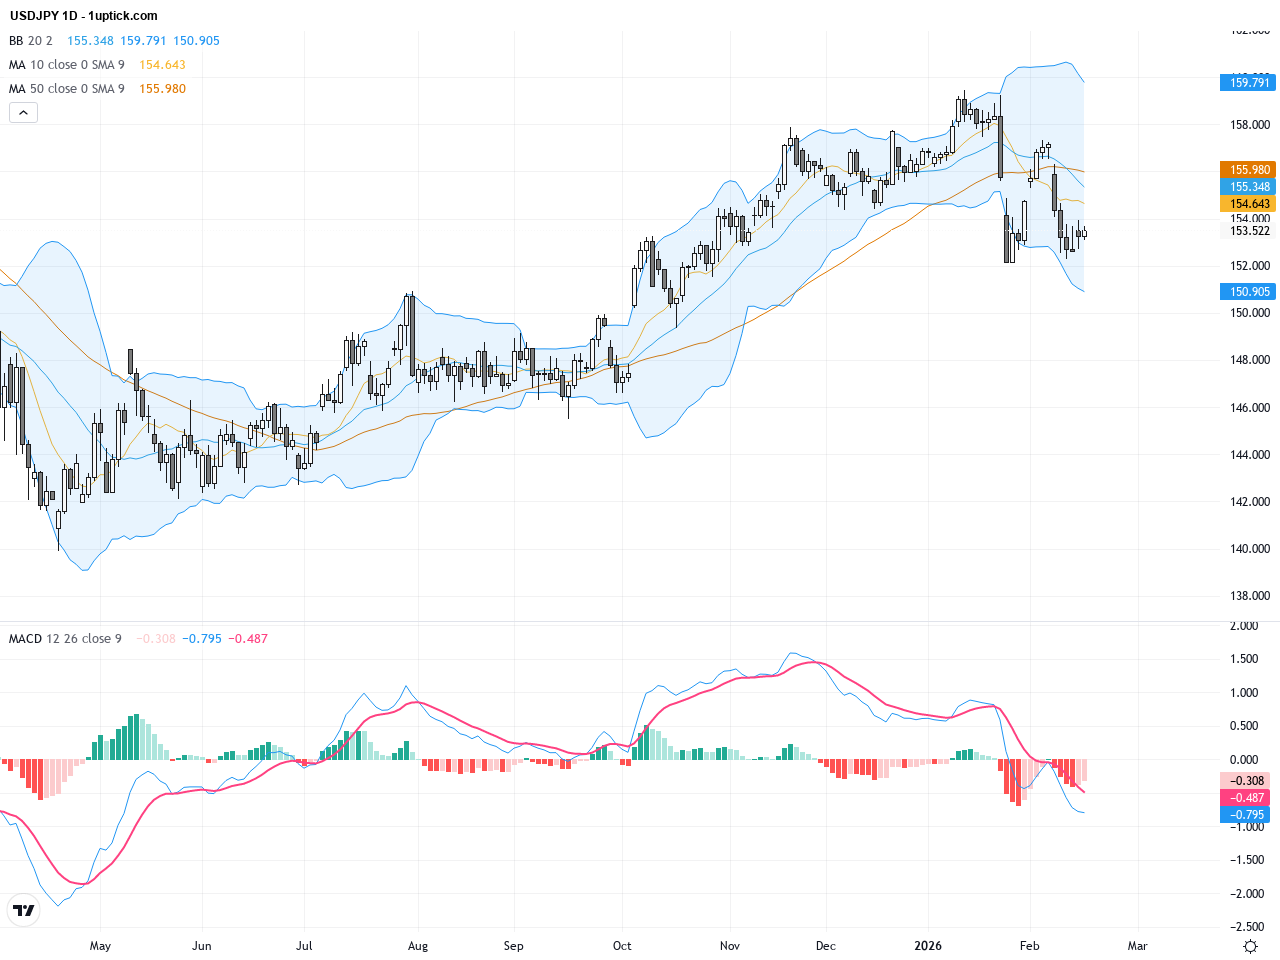
The daily chart shows USDJPY retracting from a high near 159.4, recently breaking below the 50-day moving average (~156.12) but remaining above the 200-day moving average (~150.47). This suggests a medium-term bullish bias with some corrective pressure. Bollinger Bands are narrowing, indicating reduced volatility, while the MACD continues to weaken, signaling increasing bearish momentum. Overall, the uptrend remains intact but caution is warranted for possible further pullbacks.

On the hourly chart, USDJPY fluctuates between roughly 153.7 and 153.1, forming a consolidation triangle. Prices have been consistently capped by the Bollinger Bands middle band. The MACD shows a bearish crossover, and RSI sits in a neutral-to-lower range, hinting at potential short-term downside. Trading volumes are subdued with narrowing price ranges, suggesting an imminent breakout from the current consolidation zone near the 153 level.
Technical Trend: USDJPY is currently in a cautiously bearish phase, undergoing technical consolidation within a corrective pattern, without confirming a full downtrend.
Key technical signals indicate weakening short-term momentum with the MACD bearish crossover confirming selling pressure. Daily Bollinger Bands tightening reflects decreasing volatility. The consolidation triangle pattern points to an impending directional move, with market participants watching the 153.00 psychological level and the lower Bollinger Band support closely. Holding above 153 may lead to a rebound toward 154.5+, while a break below could open the path to 151-152 price zones.Today’s Japanese trade data shows January exports up 16.8%, significantly beating the 12% forecast, reflecting strengthening fundamental support for the yen. Imports also declined 2.5%, better than the anticipated 3%, reducing trade deficit concerns. These figures are likely to fuel speculation regarding BoJ rate hikes, putting further downward pressure on USDJPY. There are no other major US or global economic events today expected to directly influence USDJPY.
Resistance & Support

The above financial market data, quotes, charts, statistics, exchange rates, news, research, analysis, buy or sell ratings, financial education, and other information are for reference only. Before making any trades based on this information, you should consult independent professional advice to verify pricing data or obtain more detailed market information. 1uptick.com should not be regarded as soliciting any subscriber or visitor to execute any trade. You are solely responsible for all of your own trading decisions.