 |
| Gold V.1.3.1 signal Telegram Channel (English) |

WTI Crude Oil Analysis: Key Resistance at $67 Amid Extended US-Iran Nuclear Talks
2026-02-27 @ 19:14
Over the past 24 to 48 hours, WTI crude oil prices have shown volatility and attempted to rebound. The closing price on February 27 was $66.56 per barrel, marking a noticeable rise compared to the previous day. Market attention has centered on the U.S.-Iran extension of nuclear talks, which significantly eased geopolitical risks and pulled oil prices back from recent highs to current levels.
According to recent market news, analysts warn that if the Vienna talks fail, crude oil prices could spike to over $100 per barrel due to lost supply from Iran and the increased costs of rerouting global oil flows. However, with the ongoing U.S.-Iran nuclear negotiations, investor confidence has somewhat recovered, suppressing further upward momentum in oil prices.
For the average investor, the extension of U.S.-Iran nuclear talks acts like a temporary relief, lowering the risk of a blunt price spike triggered by potential Middle East conflicts. Nonetheless, the oil market remains unstable, carrying an $8 to $10 risk premium, meaning future prices are still highly sensitive to developments. In the short term, oil prices may fluctuate between $64 and $67 per barrel, with investors advised to closely monitor negotiation progress and OPEC+ output decisions.
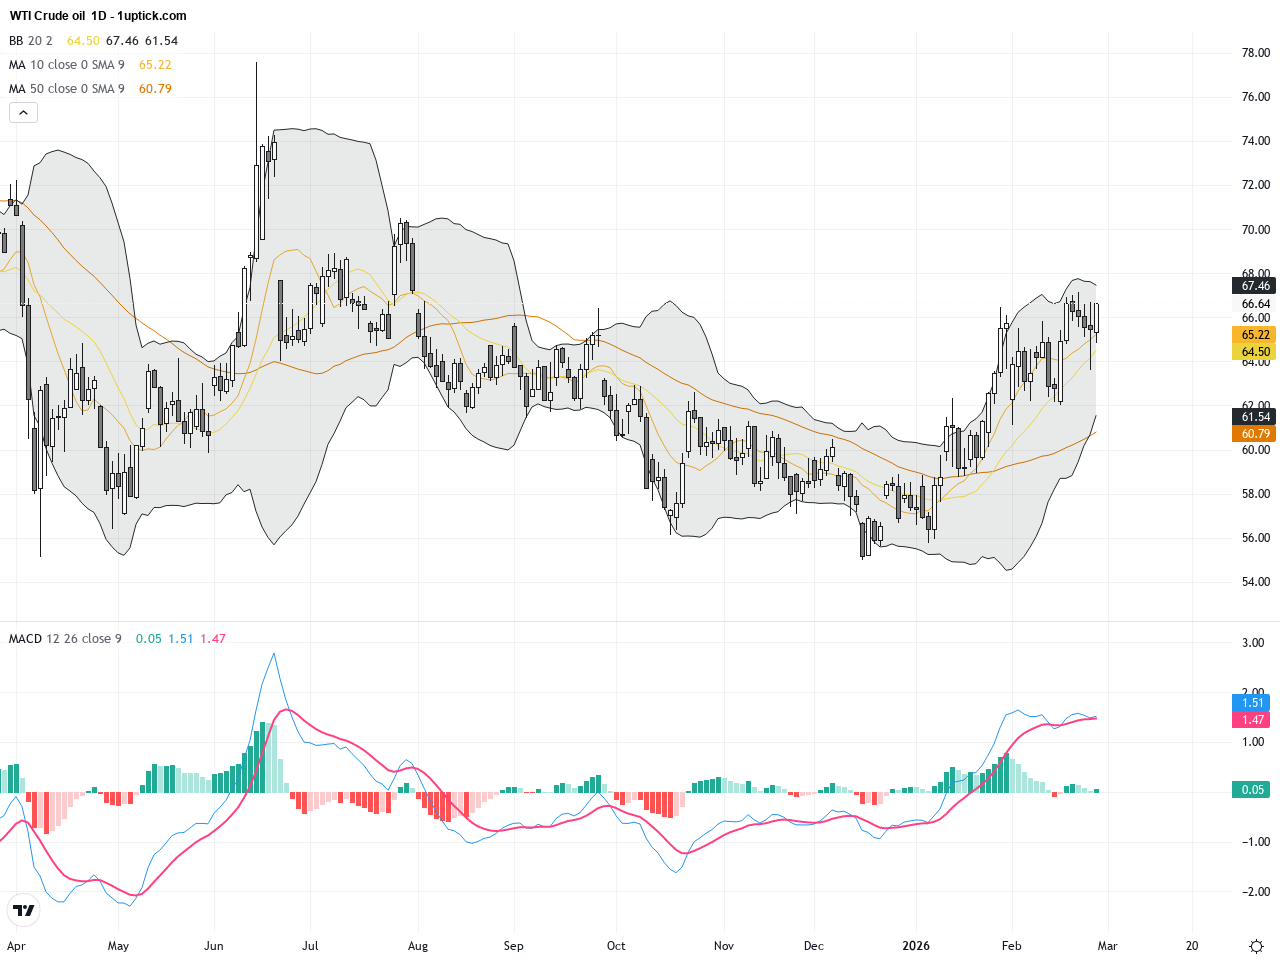
The WTI daily chart reveals an overall uptrend since mid-February, with prices fluctuating between $65 and $67 recently. Bollinger Bands are widening, indicating increased volatility. The golden cross formed by the 50-day and 200-day moving averages supports medium-term bullish momentum. The MACD remains above zero and is strengthening momentarily, confirming sustained upward momentum. Overall, the daily trend remains bullish but short-term resistance near $67 is evident.
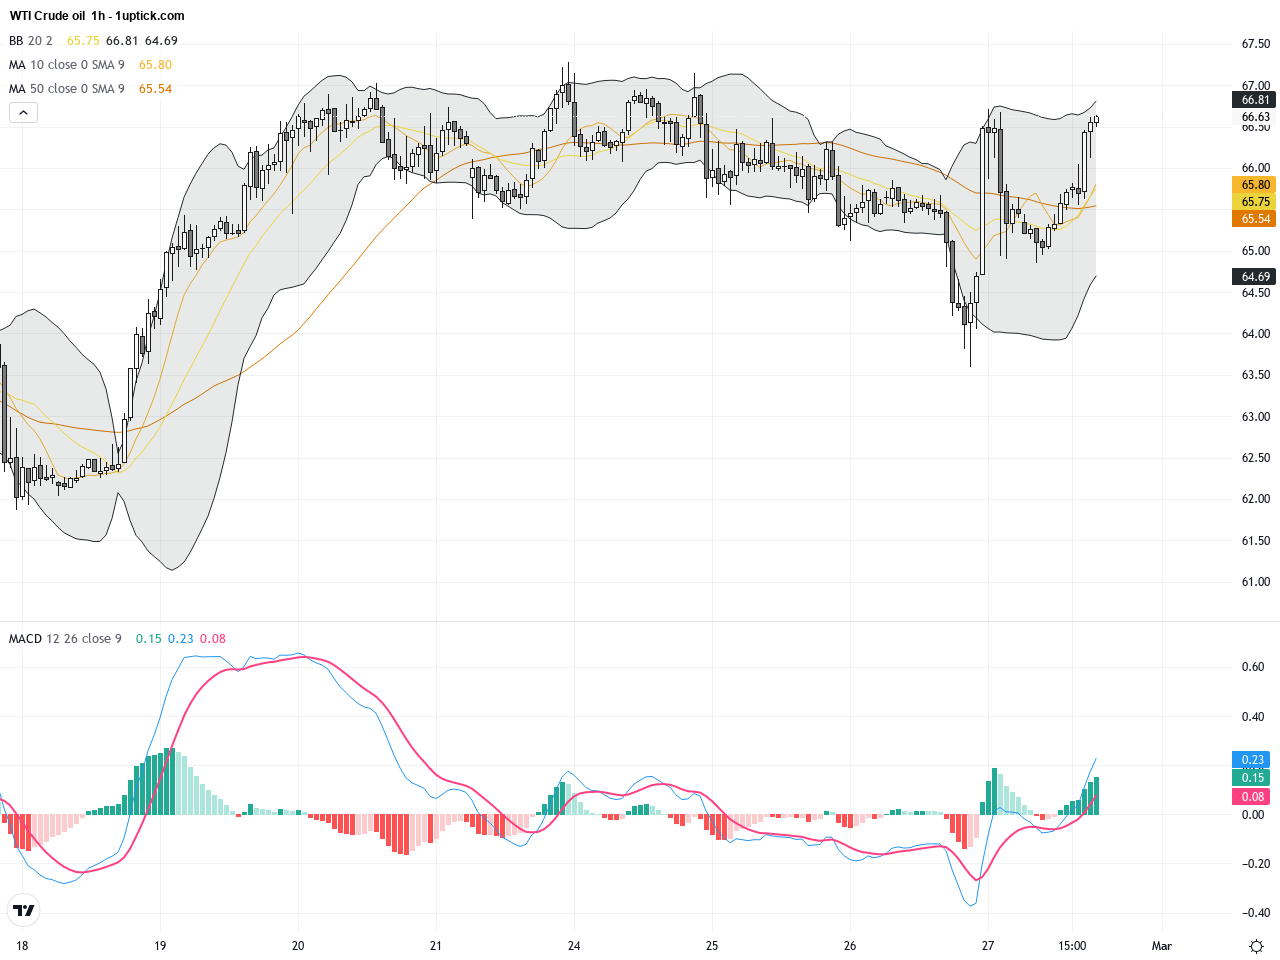
Over the past 5 days on the hourly chart, WTI has shown a steady upward bounce from a $63.6 low to about $66.5. Short-term moving averages align in a bullish pattern with multiple re-tests of the middle Bollinger Band acting as support. A double bottom on the MACD with a subsequent golden cross points to gaining short-term momentum. Recently formed Doji candlestick suggests temporary market hesitation, hinting at a possible short-lived consolidation or minor pullback.
Technical Trend: WTI Crude Oil currently exhibits a cautiously bullish oscillating upward trend, with minor short-term retracements but a dominant medium-term positive bias.
Technically, WTI sits at a critical juncture with a daily golden cross and expanding Bollinger Bands signaling bullish potential, while the hourly Doji candlestick warns of near-term uncertainty. Traders should watch for MACD sustaining its bullish cross and RSI levels which remain non-overbought, suggesting trend continuation is likely. Fundamentally, extended nuclear talks alleviate immediate supply shock risks, but the potential for a price surge to $100 remains if talks collapse, advocating for a cautious yet flexible trading approach.There are no significant direct economic events related to WTI Crude Oil scheduled for today (GMT+1). Market focus will thus remain on ongoing US-Iran nuclear negotiations and OPEC+ announcements, which are the main drivers for price movement at this time.
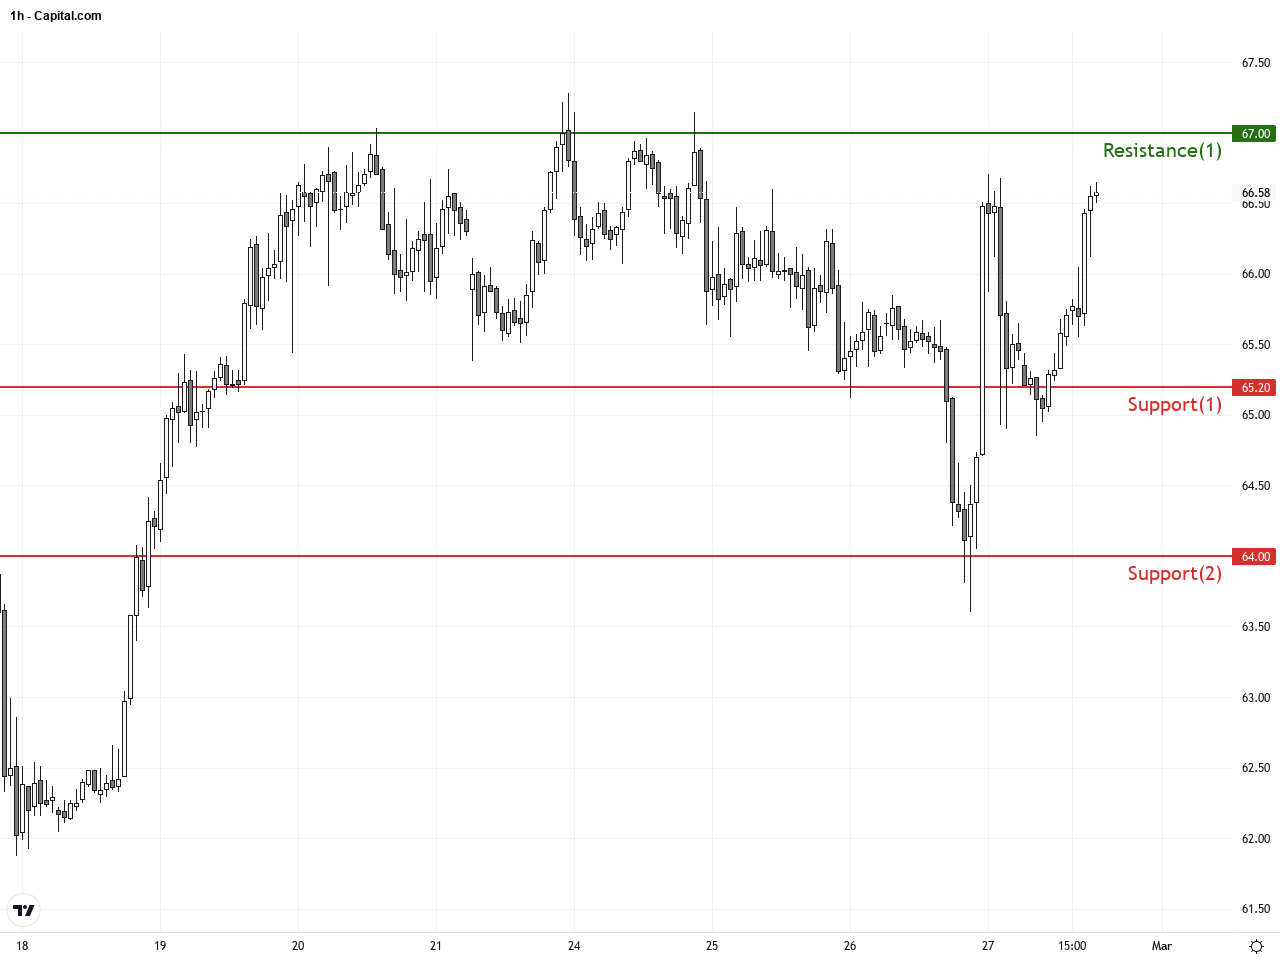
Resistance & Support
The above financial market data, quotes, charts, statistics, exchange rates, news, research, analysis, buy or sell ratings, financial education, and other information are for reference only. Before making any trades based on this information, you should consult independent professional advice to verify pricing data or obtain more detailed market information. 1uptick.com should not be regarded as soliciting any subscriber or visitor to execute any trade. You are solely responsible for all of your own trading decisions.