


 |
| Gold V.1.3.1 signal Telegram Channel (English) |
AUDUSD Breaks Below 0.7000 Amid Rising USD Strength and Middle East Tensions
2026-03-04 @ 06:01
Over the past 24 hours, the AUD/USD exchange rate has experienced a sharp decline, plunging below the key 0.7000 psychological level from yesterday’s close at 0.71028, hitting a low near 0.69478. The US dollar surged amid escalating tensions in the Middle East, directly impacting the Australian dollar and causing a daily drop exceeding 1.3%. This pullback pushed the currency pair to multi-week lows, interrupting the recent Aussie rally driven by rising inflation expectations.
In recent days, intensified conflict in the Middle East, notably the US and Israel’s military strikes against Iran, has heightened risk aversion in the markets, boosting the USD’s appeal as a safe haven. Meanwhile, despite Australia’s surprising inflation uptick fueling speculation of further rate hikes by the Reserve Bank of Australia, the Aussie dollar faced selling pressure due to geopolitical uncertainties.
For the average investor, this highlights how international political developments remain a crucial driver of currency moves. Strong economic data can be overshadowed by sudden geopolitical risks that swiftly alter market sentiment and currency trajectories. Traders should carefully assess short-term volatility risks and adjust their trading plans accordingly to avoid unwarranted losses amid heightened risk-off moods.

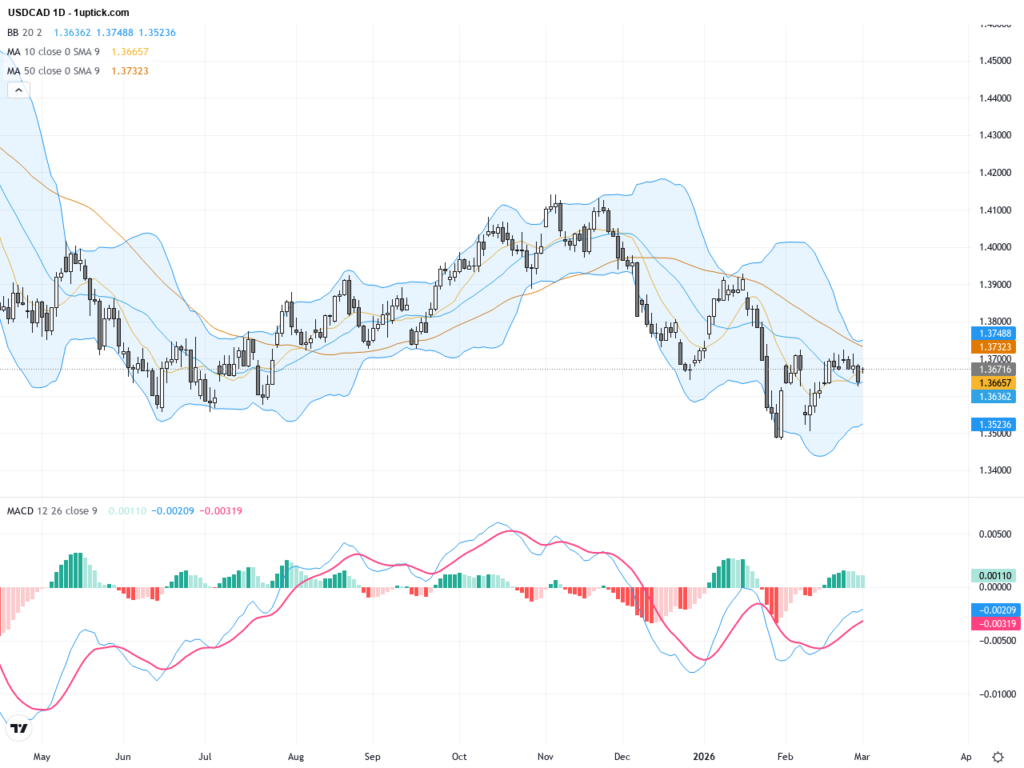
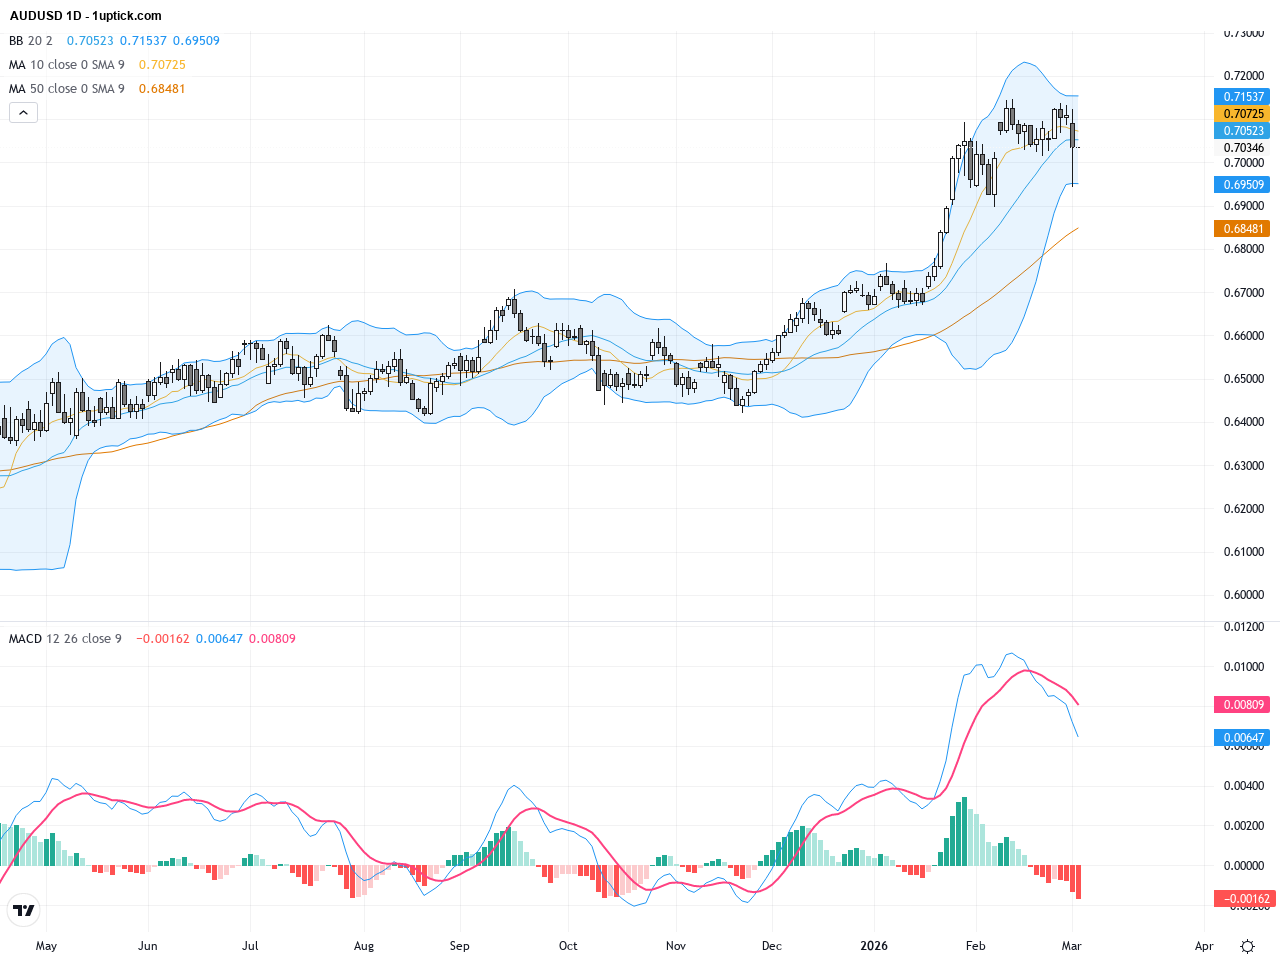
The daily chart illustrates a continued downtrend in AUDUSD, with prices dropping from the year-to-date high of 0.7147 toward the 0.70 area. The 20-day and 50-day moving averages have formed a bearish crossover, confirming bearish momentum in the medium term. Bollinger Bands are expanding downward, signaling increased volatility to the downside. The MACD indicator is declining, with the signal line crossing below zero, reinforcing the bearish trend. Overall, technicals suggest sustained downward pressure ahead.
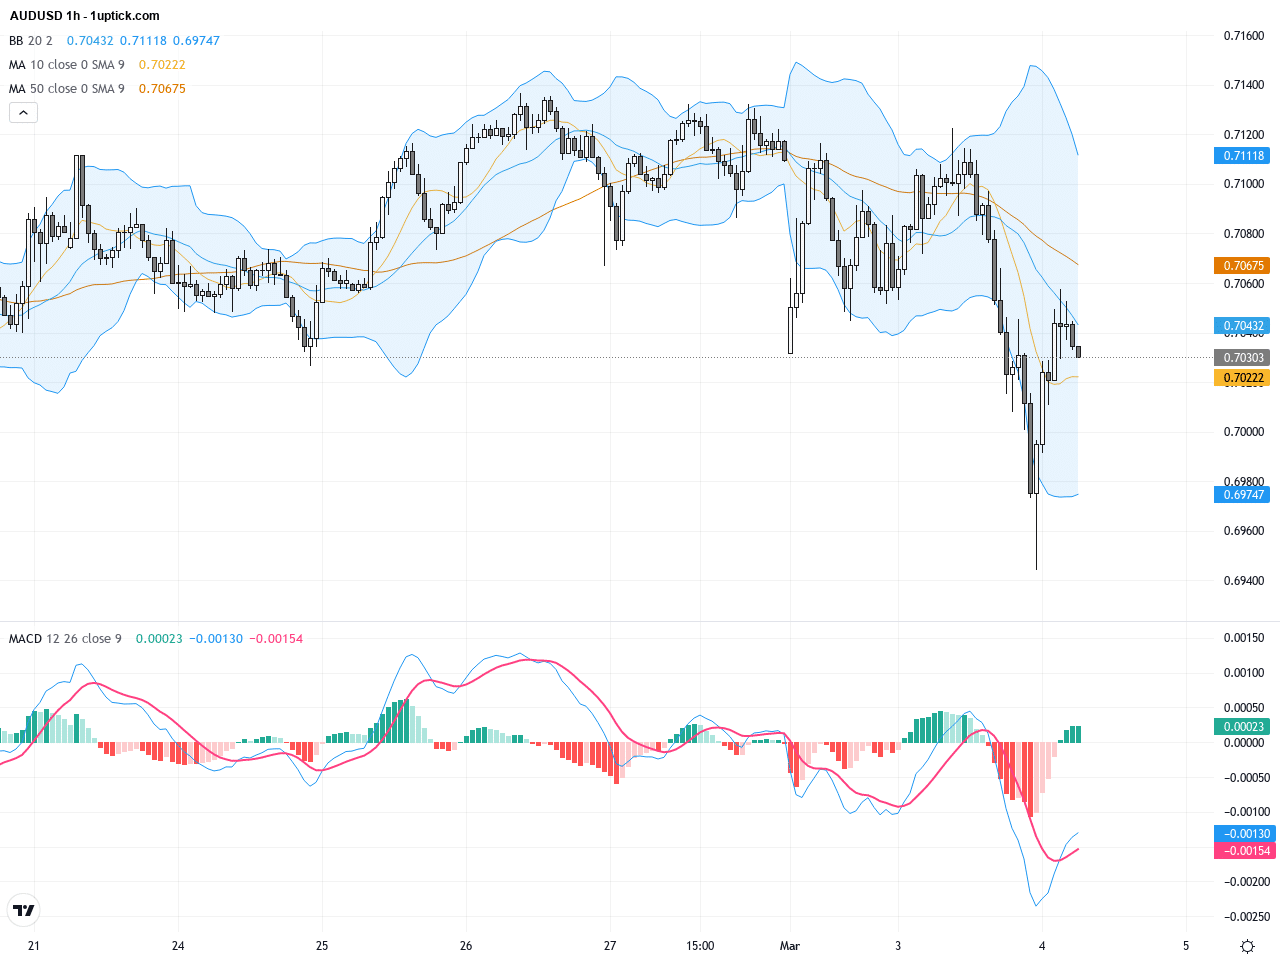
Hourly chart analysis over the past 3-5 days shows intensified volatility, especially after breaking below 0.7000 in the last 24 hours. Both the 50-hour and 100-hour moving averages exhibit a bearish alignment, and the price has repeatedly failed to break resistance levels. The MACD is increasingly negative, and RSI hovers around 30-40, indicating weakness with emerging oversold conditions. A short-lived technical rebound is possible but likely won’t reverse the broader near-term downtrend.
Technical Trend: Cautiously Bearish
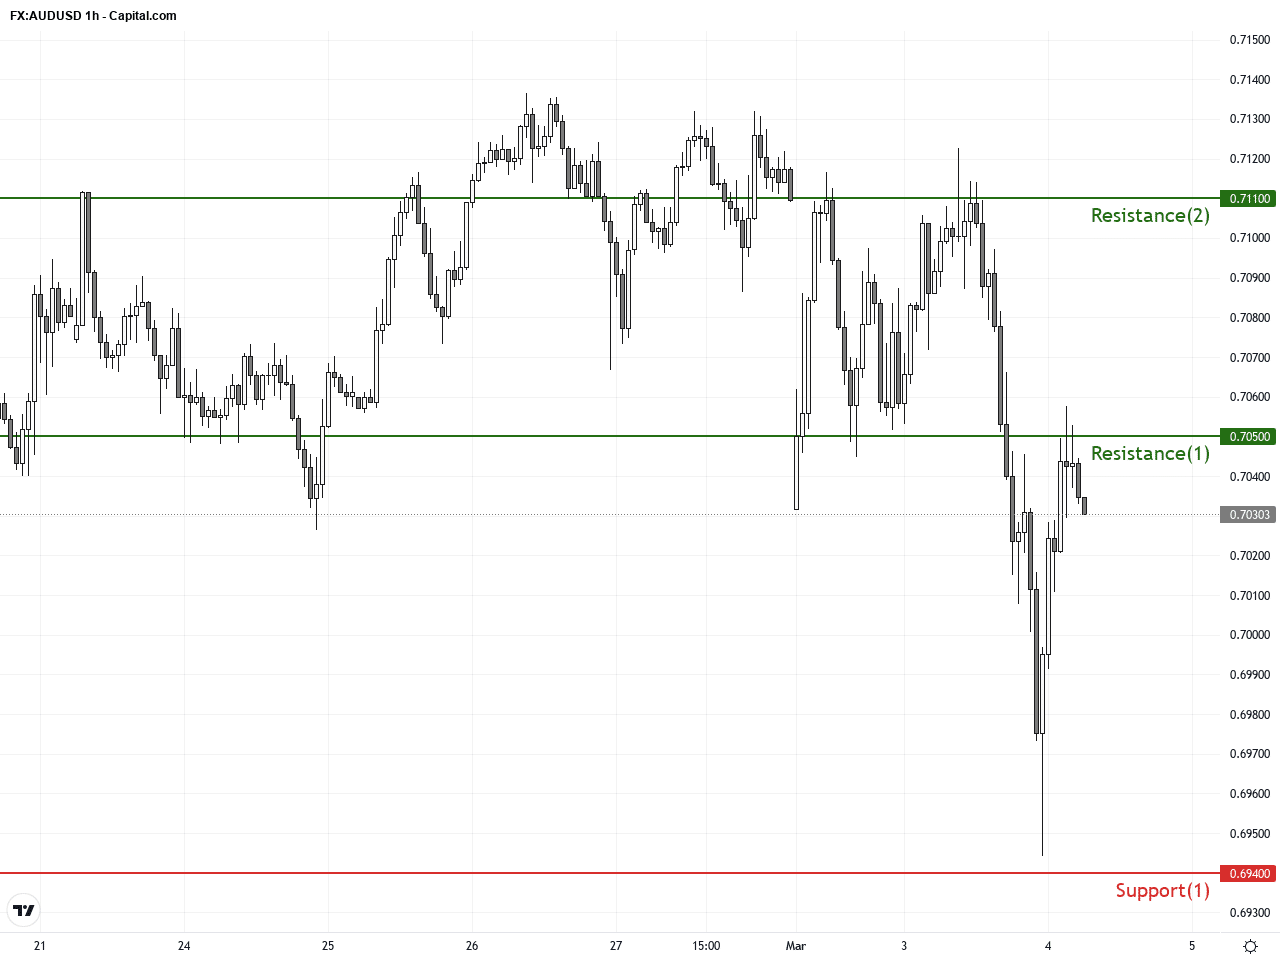
Technically, AUDUSD shows a confirmed short-term downtrend on daily charts with a bearish MACD crossover pointing to continued momentum loss. Intraday support at 0.6940 is key to watch for a potential technical bounce. Hourly charts reveal oversold readings on RSI, suggesting a possible short-term rebound. The break and hold below the 0.7000 psychological level converts this key area into resistance, cementing bearish bias near term. Traders should keep a close eye on macro news and market sentiment for the next high-probability trading opportunity.Today’s economic calendar (GMT+1) has Australian 4Q Current Account deficit and Building Approvals data which could impact AUDUSD’s direction. The wider current account deficit and declining building permits highlight economic growth risks. Japan’s unemployment rate rose slightly but is less impactful. Should Australian data miss forecasts significantly, it could add bearish pressure on AUD; better-than-expected data might offer temporary relief. Traders should monitor these releases closely in the context of geopolitical-driven risk sentiment.
Resistance & Support
The above financial market data, quotes, charts, statistics, exchange rates, news, research, analysis, buy or sell ratings, financial education, and other information are for reference only. Before making any trades based on this information, you should consult independent professional advice to verify pricing data or obtain more detailed market information. 1uptick.com should not be regarded as soliciting any subscriber or visitor to execute any trade. You are solely responsible for all of your own trading decisions.