
 |
| Gold V.1.3.1 signal Telegram Channel (English) |
AUDUSD: Bullish Rebound Supported by Hawkish RBA and Strong Technical Patterns
2026-03-18 @ 06:01
Over the past 24 to 48 hours, the Australian Dollar versus US Dollar (AUD/USD) demonstrated a notable rebound. Closing yesterday at 0.71018, the pair opened slightly lower but gradually climbed as risk appetite began to return to the markets. This rebound was primarily driven by the supportive hawkish stance from the Reserve Bank of Australia (RBA) paired with a softer US Dollar.
Recent market news highlights that despite some US Dollar softness leading to broad risk asset gains, the Australian Dollar has gained clear upward momentum in this environment. In particular, RBA officials emphasized that inflation remains elevated, signaling a possibility of continued tightening policies, which enhanced AUD’s appeal. For investors, this can be understood as risk sentiment easing on Dollar weakness, triggering a capital flow back into commodity-linked currencies like AUD and Australian markets, thus pushing AUD/USD higher.
In summary, the price action over the last two days for AUD/USD reflects a classic combination of hawkish interest rate signals and US Dollar weakness, offering investors a compelling hedge and investment option amid ongoing global macroeconomic and geopolitical developments.
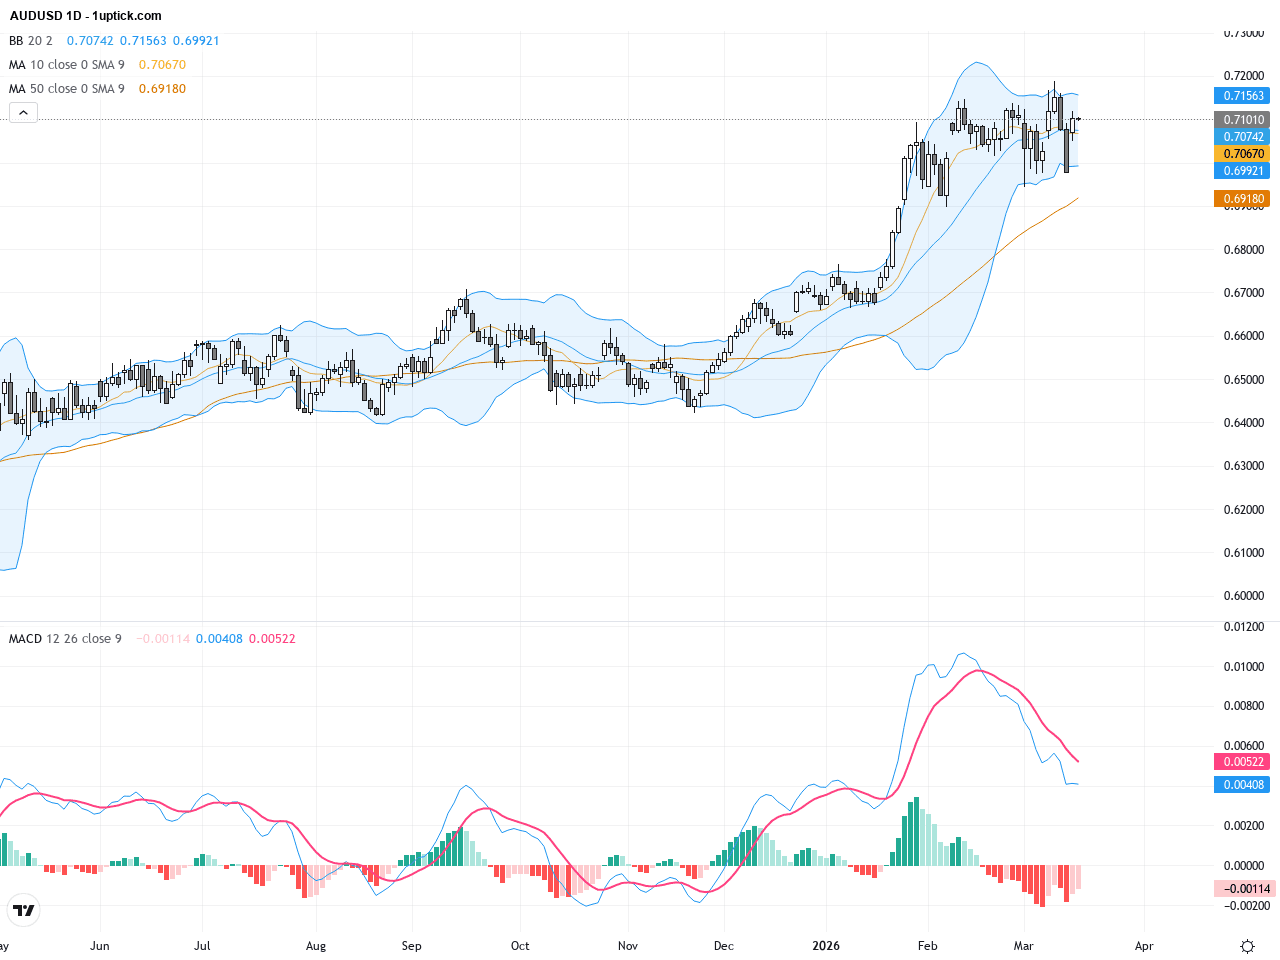
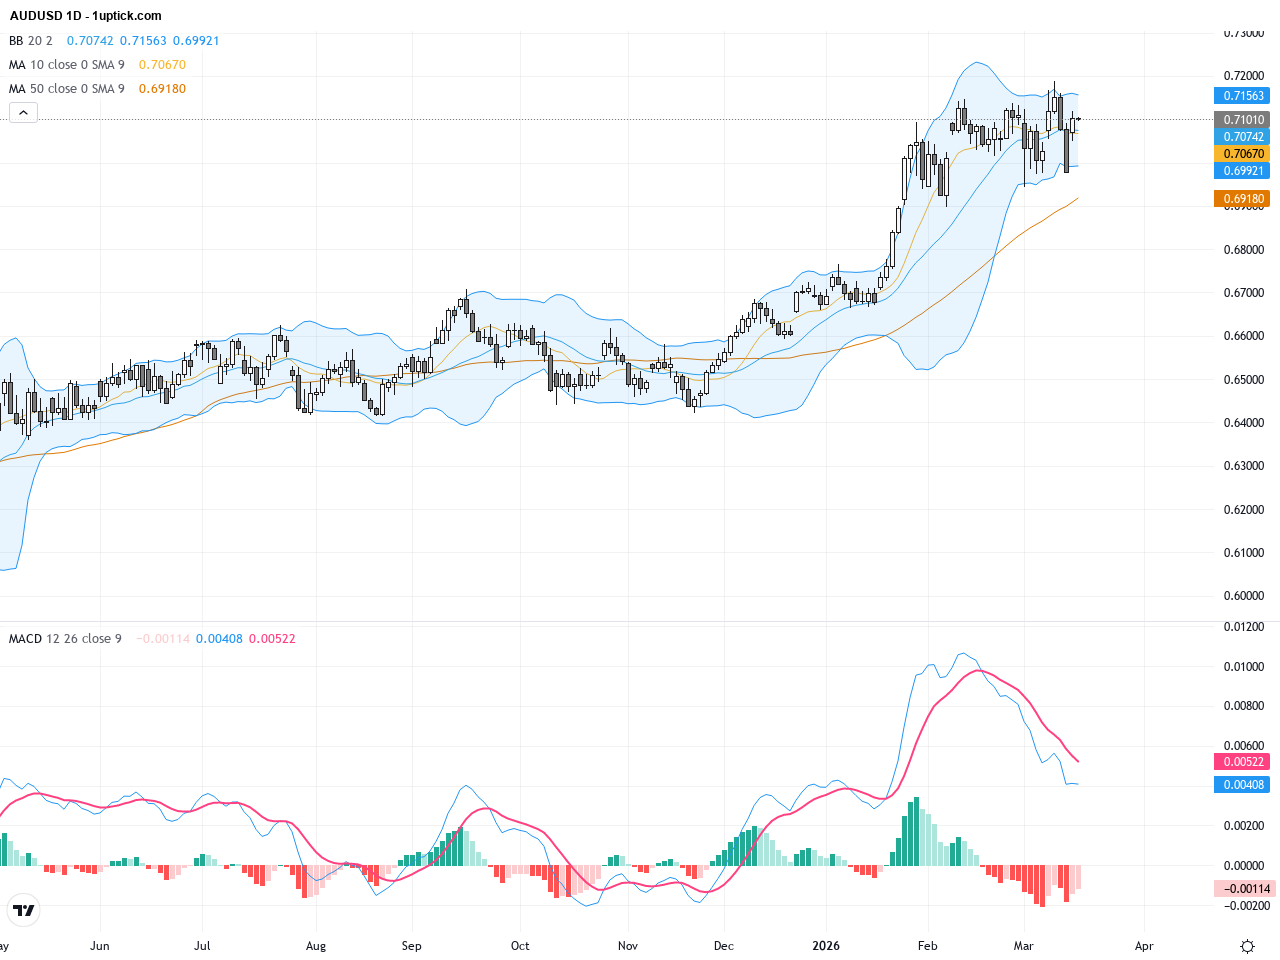
The daily chart shows that AUDUSD has maintained a steady uptrend since early 2026, challenging multiple highs established earlier in the year. The 50-day moving average (~0.701) is trending upwards, with the price well above the 200-day MA (~0.668), confirming a strong long-term bullish trend. Bollinger Bands are expanding with price near the upper band, indicating increased volatility. The MACD is in positive territory and widening, reinforcing strong buying momentum and a bullish outlook on the daily timeframe.

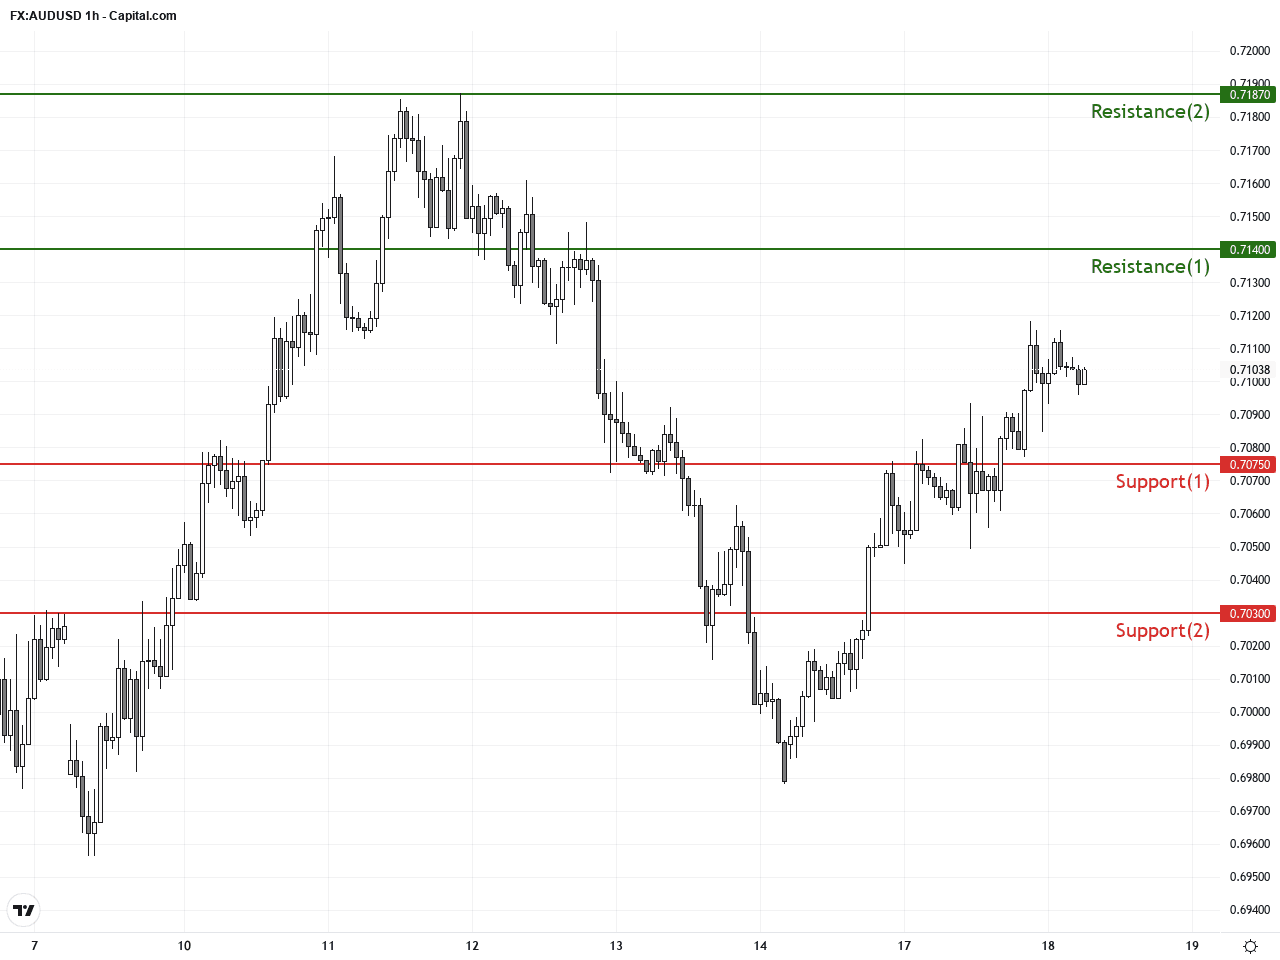
The hourly chart over the last 3-5 days reveals AUDUSD trading in a 0.701 to 0.712 range, showing short-term bullish consolidation. Price remains above the 50-hour moving average and Bollinger Bands initially narrow before slight expansion, signaling a potential breakout soon. The MACD recently formed a bullish crossover, and RSI remains above 60, reflecting strengthening buyer momentum and optimistic short-term sentiment. Traders should watch for a break above key resistance levels.
Technical Trend: AUDUSD is currently in a decisively bullish trend with strong momentum and stable upward movement. Short-term sentiment is increasingly positive, reflecting steady upward pressure.
Technically, the daily chart confirms a sustained bullish trend with expanding MACD pointing to strong momentum continuation. The hourly chart’s bullish MACD crossover and RSI above 50 indicate an imminent upward breakout possibility in the near term. A failure to surpass the 0.7140 resistance could trigger a brief pullback. Overall, the alignment of MACD and moving averages signals a clear buying opportunity on dips, with underlying strength intact.Today’s economic calendar shows the Australian Interest Rate Decision at 04:30 GMT+1 held steady at 4.10%, in line with expectations, supporting the Aussie’s firm footing. RBA Deputy Governor Bullock’s speech at 05:30 GMT+1 is the key event to watch, as his tone could trigger short-term volatility. Other releases like China’s Producer Price Index and Italy’s CPI have limited direct impact on AUDUSD. Overall, no major direct events are expected to sway AUDUSD today, with price action likely driven mainly by risk sentiment and central bank commentary.
Resistance & Support
The above financial market data, quotes, charts, statistics, exchange rates, news, research, analysis, buy or sell ratings, financial education, and other information are for reference only. Before making any trades based on this information, you should consult independent professional advice to verify pricing data or obtain more detailed market information. 1uptick.com should not be regarded as soliciting any subscriber or visitor to execute any trade. You are solely responsible for all of your own trading decisions.