


 |
| Gold V.1.3.1 signal Telegram Channel (English) |

AUDUSD: Multi-Year High Breakout at 0.7168 Signals Strong Trading Outlook
2026-03-11 @ 06:01
Over the past 24 to 48 hours, the Australian Dollar to US Dollar (AUD/USD) has experienced notable volatility, hitting a multi-year high. The closing price yesterday stood at 0.71164, with intraday highs reaching 0.71683, marking a three-year peak.
Latest market news highlights that the AUD/USD breakout above the key 0.7100 level is primarily driven by the Reserve Bank of Australia’s (RBA) hawkish stance, encouraging investor confidence in the Aussie. Additionally, the divergence in monetary policies between the RBA and the US Federal Reserve has widened interest rate differentials, boosting demand for the Australian Dollar. Although geopolitical risks such as the Middle East tensions have injected uncertainty, the “war premium” effect has been outweighed by renewed global risk appetite, drawing funds into AUD.
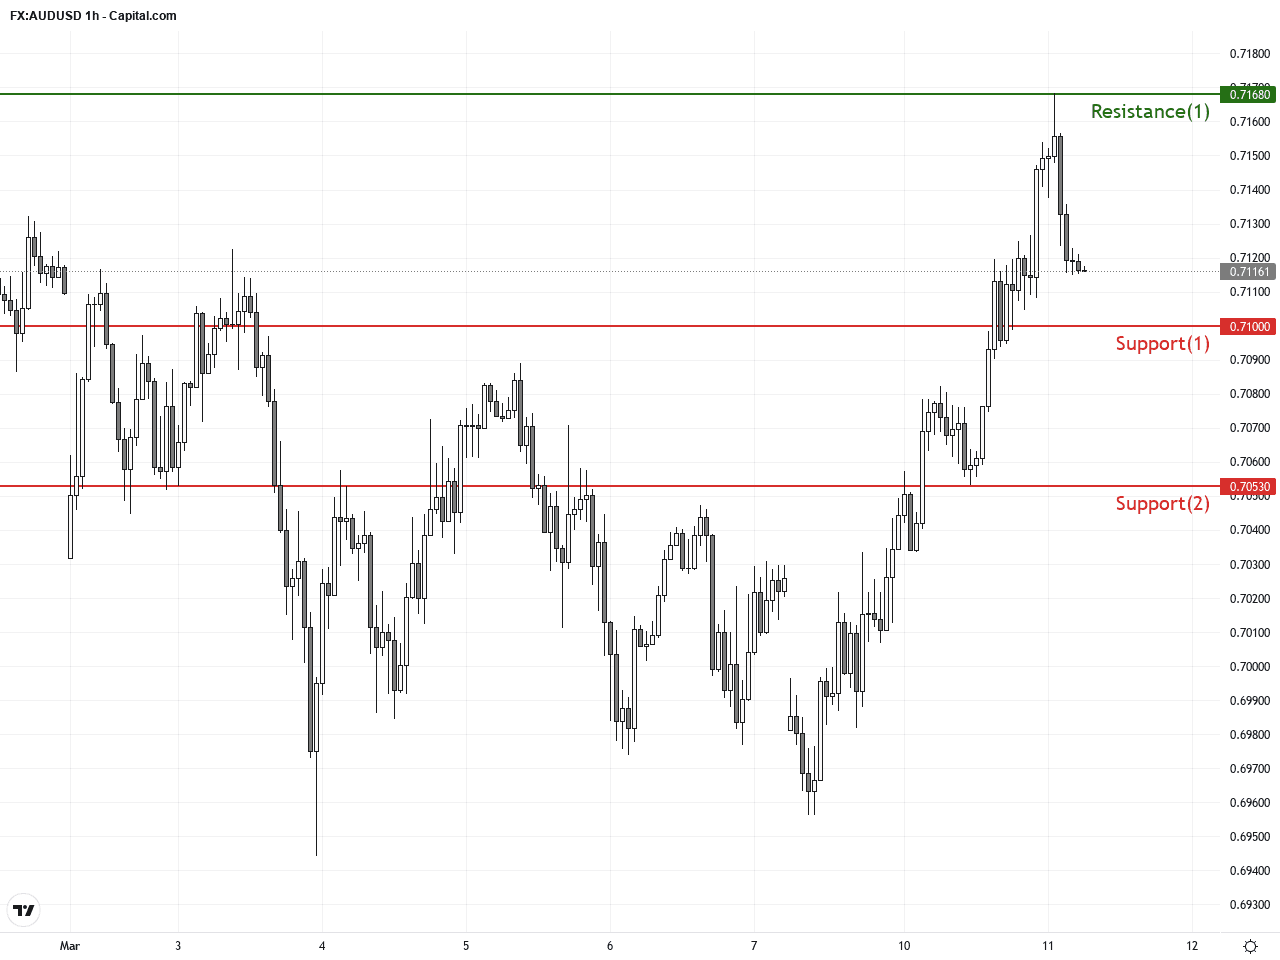
For the average investor, this means the AUD is benefiting from several favorable forces including stronger domestic economic fundamentals and diminishing safe-haven buying globally. Should the pair sustain above the 0.7168 resistance, market participants look toward targets of 0.7200 and potentially as high as 0.7300. However, a pullback below the 0.7100 mark could risk a decline toward 0.7053 and possibly the 0.7000 support level.
Overall, the recent strength in AUD/USD underscores Australian economic resilience combined with shifting global market sentiment. Investors should keep a close eye on policy moves from both the RBA and Fed alongside evolving geopolitical developments.
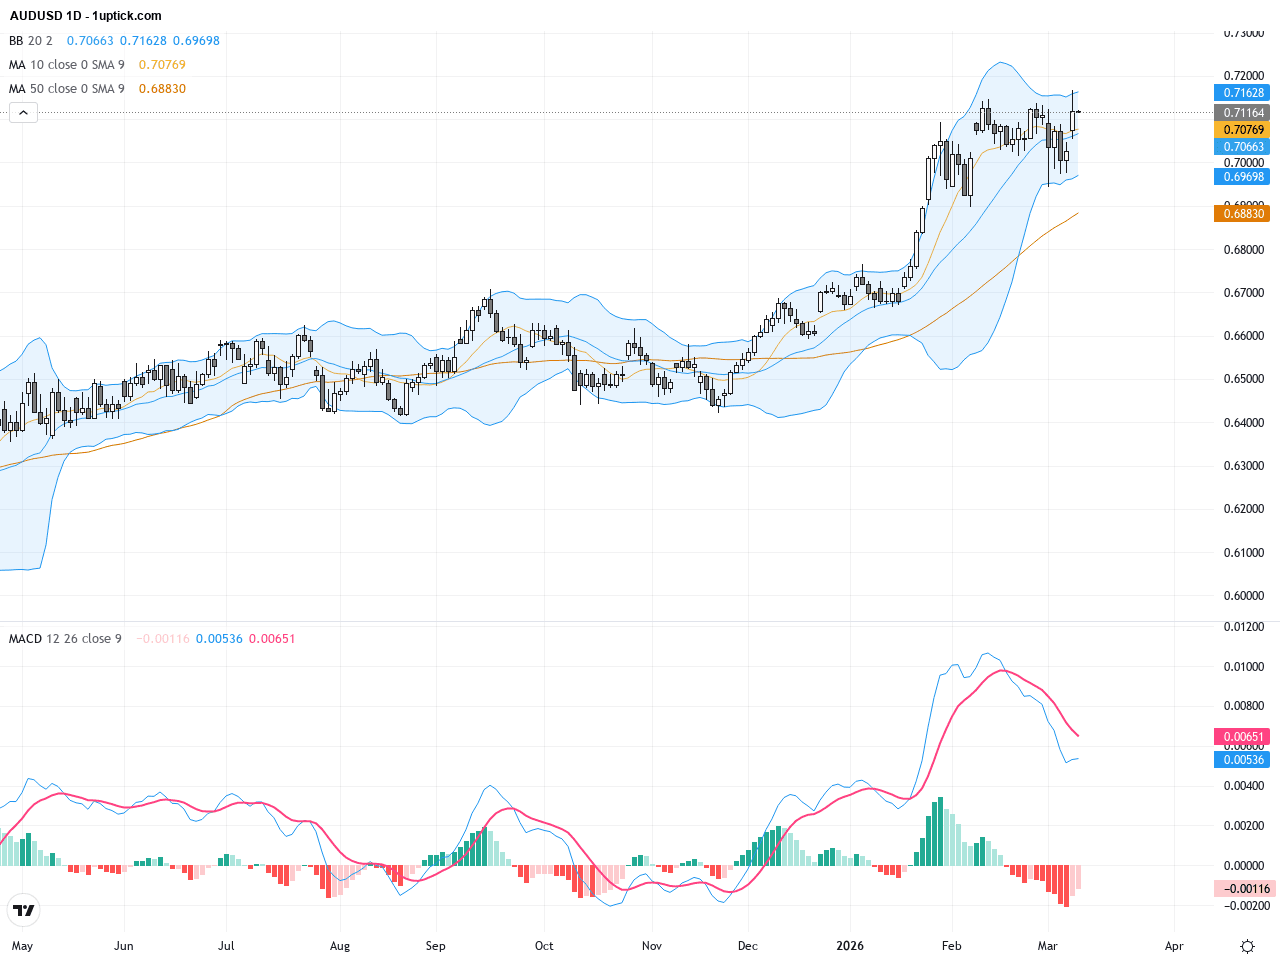
On the daily chart, AUDUSD shows a robust rebound from recent lows, with the price firmly above the 20-day moving average (MA) and both 50-day and 200-day MAs, indicating a clear medium to long-term uptrend. The Bollinger Bands are expanding, suggesting increased volatility, with price nearing the upper band. The MACD remains positive with the fast line above the slow, signaling sustained bullish momentum. Overall, the daily trend leans bullish but faces multiple resistance around 0.7168 that could invite some corrective pressures.
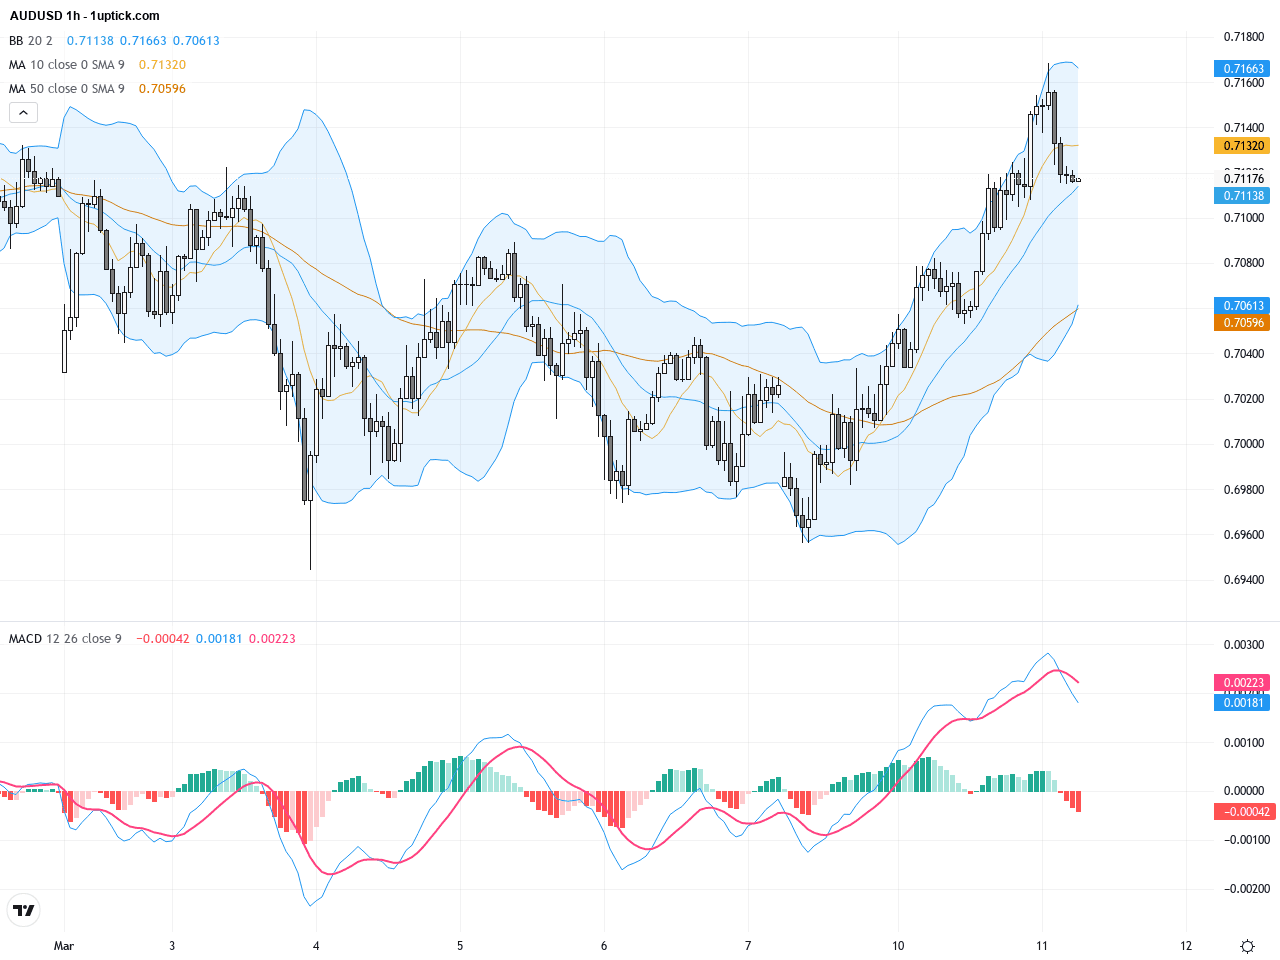
The hourly chart reveals notable price fluctuations over the past 3-5 days, forming a subtle wedge consolidation near 0.7150 resistance. The 20 EMA acts as a reliable short-term support holding the price, while the Bollinger Bands begin to contract, hinting at upcoming trend acceleration. The MACD shows a bullish crossover on the hourly timeframe with rising volume, indicating strengthening short-term buying pressure. The key consolidation range between 0.7100 and 0.7168 is critical; a breakout could target 0.7200 and 0.7250.
Technical Trend: Sustained Uptrend (Decisively Bullish)
Technically, AUDUSD is building a bullish foundation supported by the MACD bullish crossover and sustained price above the 20-day EMA. The daily Bollinger Bands expansion coupled with price near resistance levels highlights a short-term challenge. On the hourly chart, the wedge consolidation breakout may trigger strong bullish momentum. Traders should closely watch the key support and resistance levels near 0.7100 and 0.7168 as these will dictate the next move.Today’s GMT+1 economic calendar features Japanese data releases including January household spending and Q4 GDP figures, both beating expectations, supporting Asia-Pacific currencies. Additionally, China’s robust February import and export data far exceeded forecasts, indirectly supporting the Australian dollar due to close trade ties. No major direct economic events impacting AUDUSD are scheduled from the U.S. or Australia today. The current market focus remains on Asian data and geopolitical developments, which may bolster AUDUSD sentiment.
Resistance & Support
The above financial market data, quotes, charts, statistics, exchange rates, news, research, analysis, buy or sell ratings, financial education, and other information are for reference only. Before making any trades based on this information, you should consult independent professional advice to verify pricing data or obtain more detailed market information. 1uptick.com should not be regarded as soliciting any subscriber or visitor to execute any trade. You are solely responsible for all of your own trading decisions.