


 |
| Gold V.1.3.1 signal Telegram Channel (English) |
AUDUSD Technical and Fundamental Analysis: Watch the Key 0.7000 Support Amid Hormuz Strait Risks
2026-03-23 @ 06:01
Over the past 24 to 48 hours, the Australian Dollar against the US Dollar (AUD/USD) experienced significant volatility, ultimately showing a mixed but resilient trend. The closing price yesterday was 0.70863, slipping to around 0.69935, marking a decline of approximately 1.3%. The key driver behind this movement was geopolitical tension in the Strait of Hormuz, which triggered a flight to safety, strengthening the US Dollar and putting downward pressure on the AUD.
Meanwhile, the hawkish stance from the Reserve Bank of Australia (RBA) and solid domestic economic data provided underlying support for the Aussie, helping it resist deeper losses. Market participants maintain a generally positive outlook, anticipating further tightening from the RBA to boost the currency. However, the Hormuz crisis, which pushed oil prices higher and heightened risk aversion, created a clear contrast, illustrating the market’s current tug of war between risk appetite and safe-haven demand.
For the average investor, this scenario can be understood as a delicate balancing act: while Australia’s economic fundamentals support a bullish view for the AUD, rising global political risks draw capital toward the US Dollar as a safe haven. Moving forward, keeping a close eye on geopolitical developments alongside RBA policy signals will be critical, as these headwinds and tailwinds continue to shape the AUD/USD’s near-term trajectory.
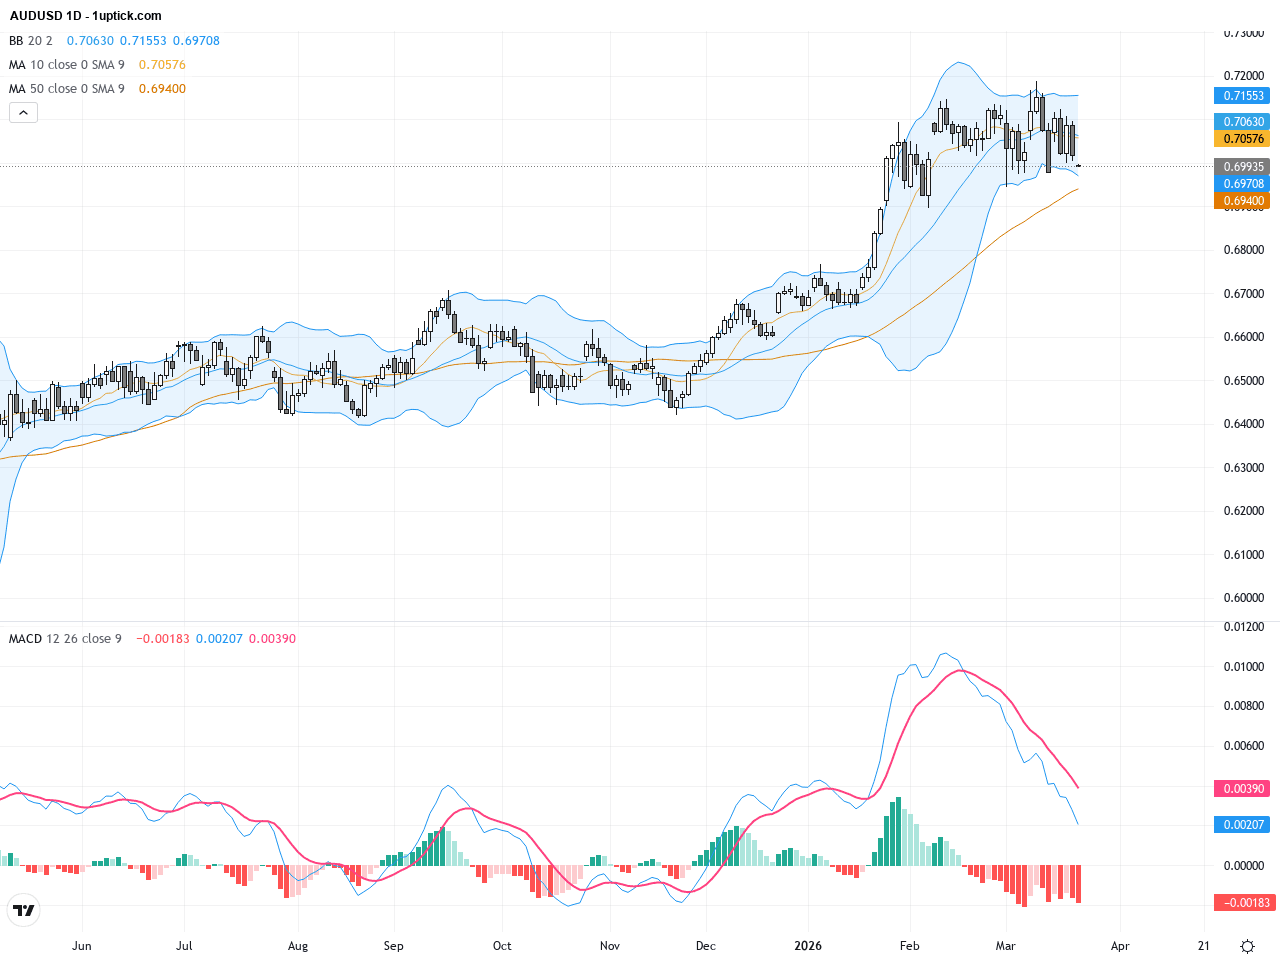
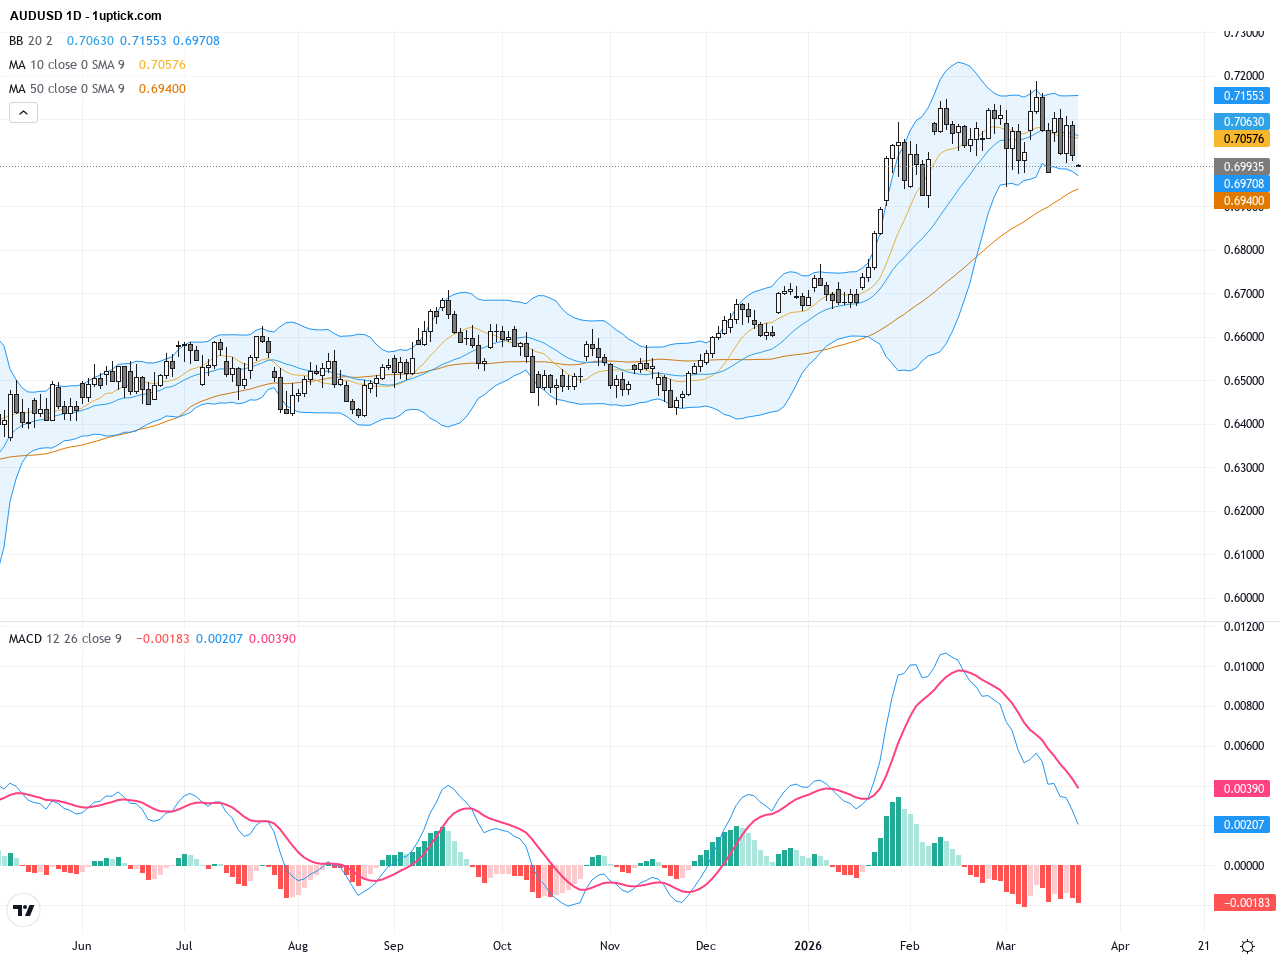
The daily chart reveals a clear uptrend for AUDUSD since the beginning of the year, with the 50-day moving average comfortably above 0.70378 and the 200-day at 0.66908, confirming a bullish medium-to-long term outlook. Price recently hit the 2026 high of 0.71872 before retreating, with Bollinger Bands tightening indicating increased consolidation. The MACD remains positive but the histogram shrinking suggests waning bullish momentum, while RSI nearing the neutral zone implies potential range-bound behavior ahead. Overall, the daily trend remains bullish but short-term corrections are likely.
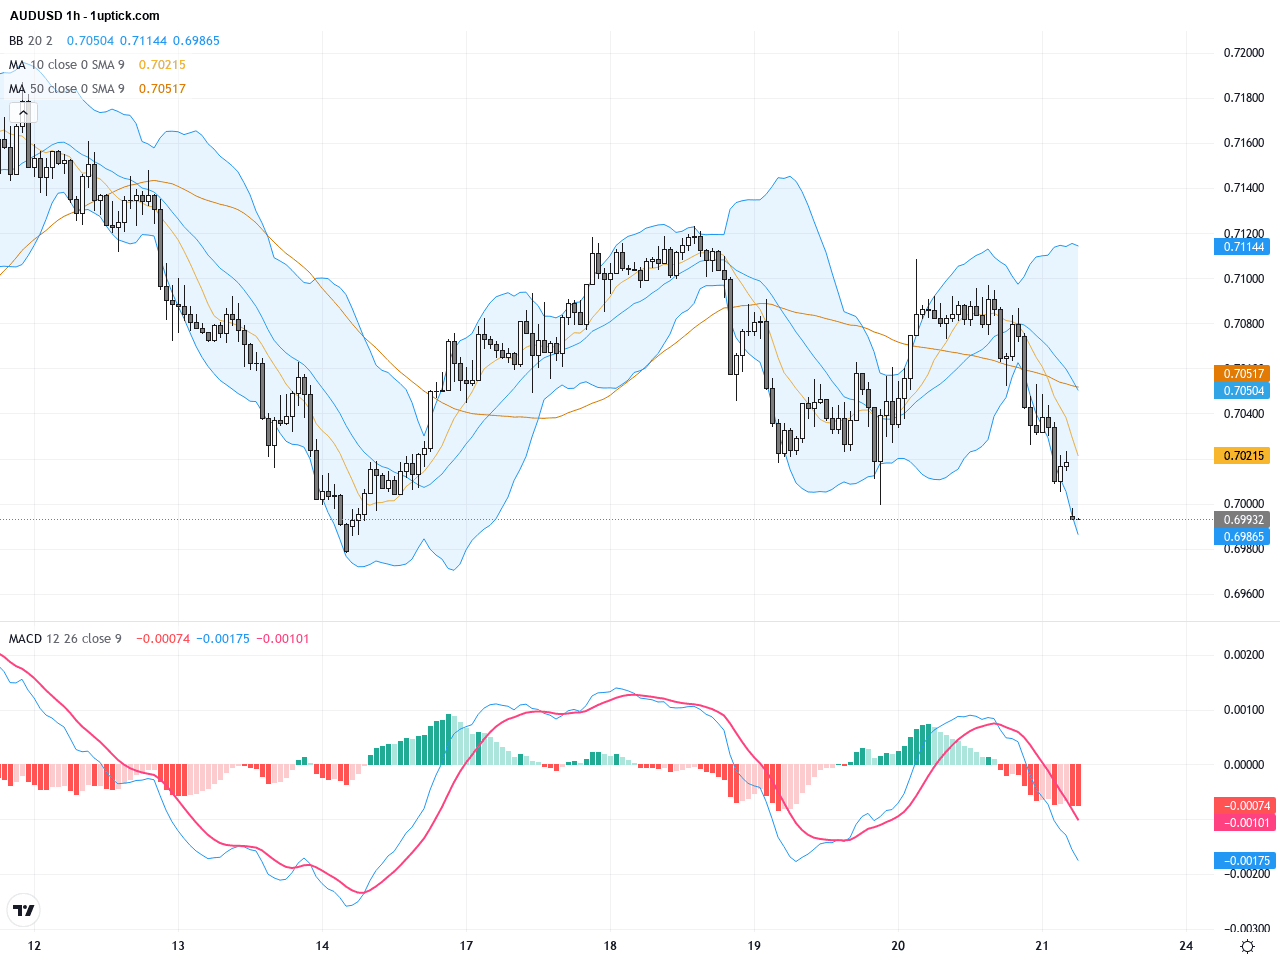
The hourly chart over the past 5 days shows a notable short-term downtrend, with prices falling from around 0.7100 and breaching the psychologically critical 0.7000 level. Short-term moving averages have formed a bearish crossover while Bollinger Bands expanding reflect growing volatility. The MACD’s fast line crossing below the slow line confirms weakening momentum. A descending triangle pattern has developed recently; a break below 0.6980 would confirm a bearish signal. The near-term is marked by volatile swings and potential pullbacks, warranting caution for short-term traders.
Technical Trend: Currently, the trend is cautiously bearish, with increased volatility and short-term downside risks, while still retaining medium-term rebound potential.
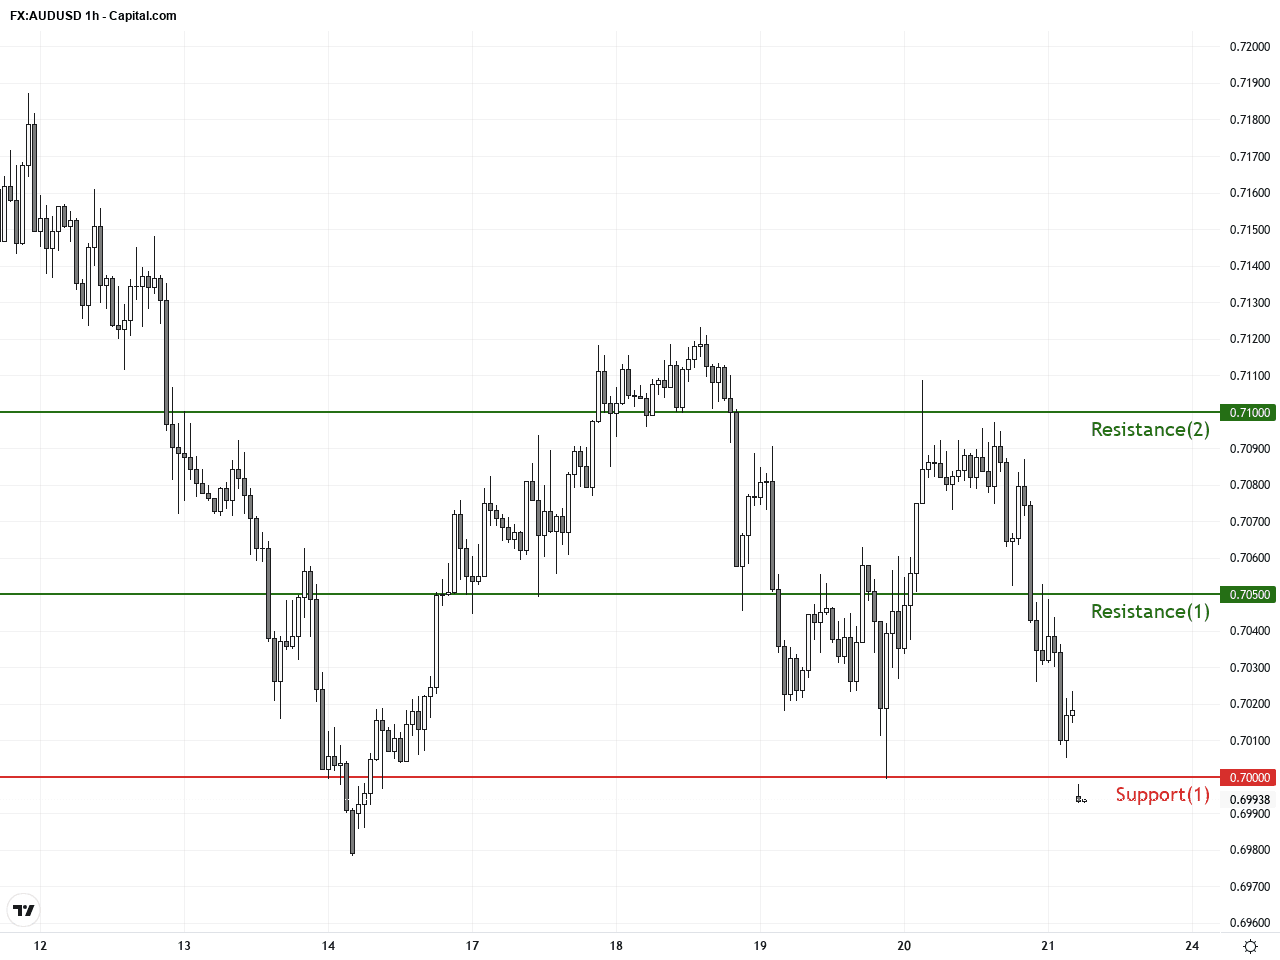
Technically, AUDUSD is testing the critical 0.7000 support zone; a break downward could push the pair further toward 0.6950 and 0.6900 levels. The MACD bearish crossover and neutral to weak RSI point to near-term selling pressure, but the daily trend has not turned fully negative yet. A swift rebound above the 10-day moving average would be a key signal for momentum recovery. The descending triangle formation suggests caution, while a break above 0.7050 resistance may revive bullish sentiment.There are no significant or directly relevant economic events scheduled today that would impact AUDUSD. Market focus remains on geopolitical risks and RBA policy outlook as the primary influences on price action.
Resistance & Support
The above financial market data, quotes, charts, statistics, exchange rates, news, research, analysis, buy or sell ratings, financial education, and other information are for reference only. Before making any trades based on this information, you should consult independent professional advice to verify pricing data or obtain more detailed market information. 1uptick.com should not be regarded as soliciting any subscriber or visitor to execute any trade. You are solely responsible for all of your own trading decisions.