


 |
| Gold V.1.3.1 signal Telegram Channel (English) |

AUDUSD: Technical Consolidation Signals Critical Support and Resistance Levels
2026-03-27 @ 06:01
Over the past 24 to 48 hours, the AUD/USD pair has experienced notable volatility. The closing price yesterday was 0.69463 USD, but prices have dropped to around 0.68886 USD, reflecting a decline of 0.83%. The market has been influenced by multiple factors, including mixed Australian inflation data and shifting global risk sentiment, causing investors to take a cautious stance on the Australian dollar in the short term.
Recent market news highlights rising uncertainty surrounding Middle East tensions that have bolstered the US dollar, putting additional pressure on the AUD. Despite uneven inflation figures, the commodity demand surge fueled by emerging technological advances, and anticipated RBA policy outlook provide some support for the AUD, these positives were offset by the attraction of the USD as a safe-haven currency.
For the average investor, it helps to think of the market as a rollercoaster driven by geopolitical uncertainties, where the US dollar acts like a safe zone, while the Australian dollar, linked heavily with commodity prices, faces tug-of-war forces resulting in volatility. This means that if geopolitical tensions continue to escalate, the AUD may face further pressure in the near term. However, with improved outlook for technology and commodity demand, there remains potential for a rebound in the longer term.
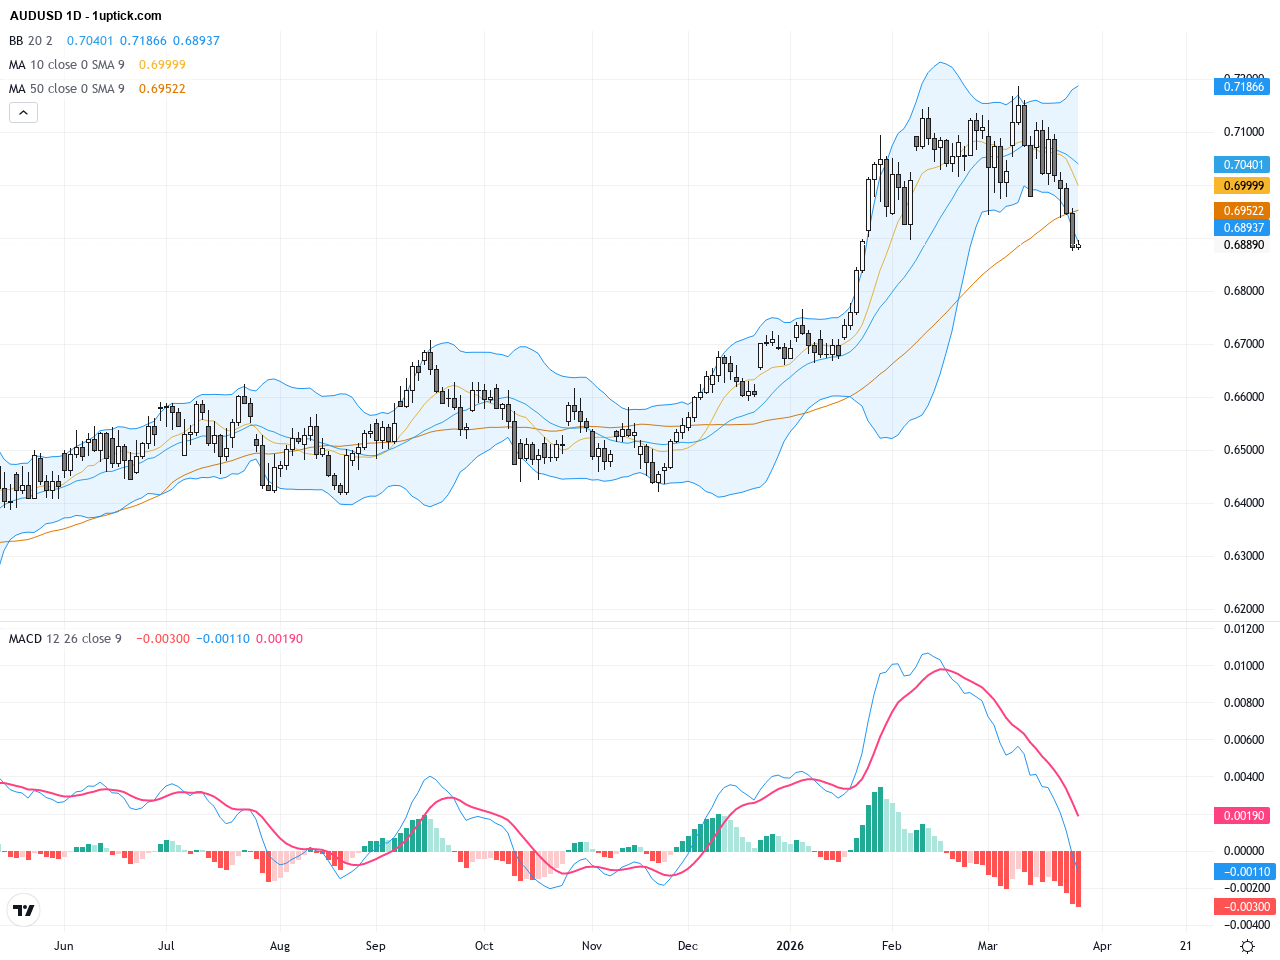
The daily chart shows AUDUSD in a broader uptrend since the start of the year, supported by the 200-day moving average near 0.670. Recently, price met resistance around the 50-day MA at 0.704, indicating selling pressure. Bollinger Bands are narrowing, with the price below the middle band, suggesting potential short-term downside. The MACD reveals a weakening bullish momentum with a bearish crossover developing but no clear death cross yet, indicating consolidation rather than a reversal.
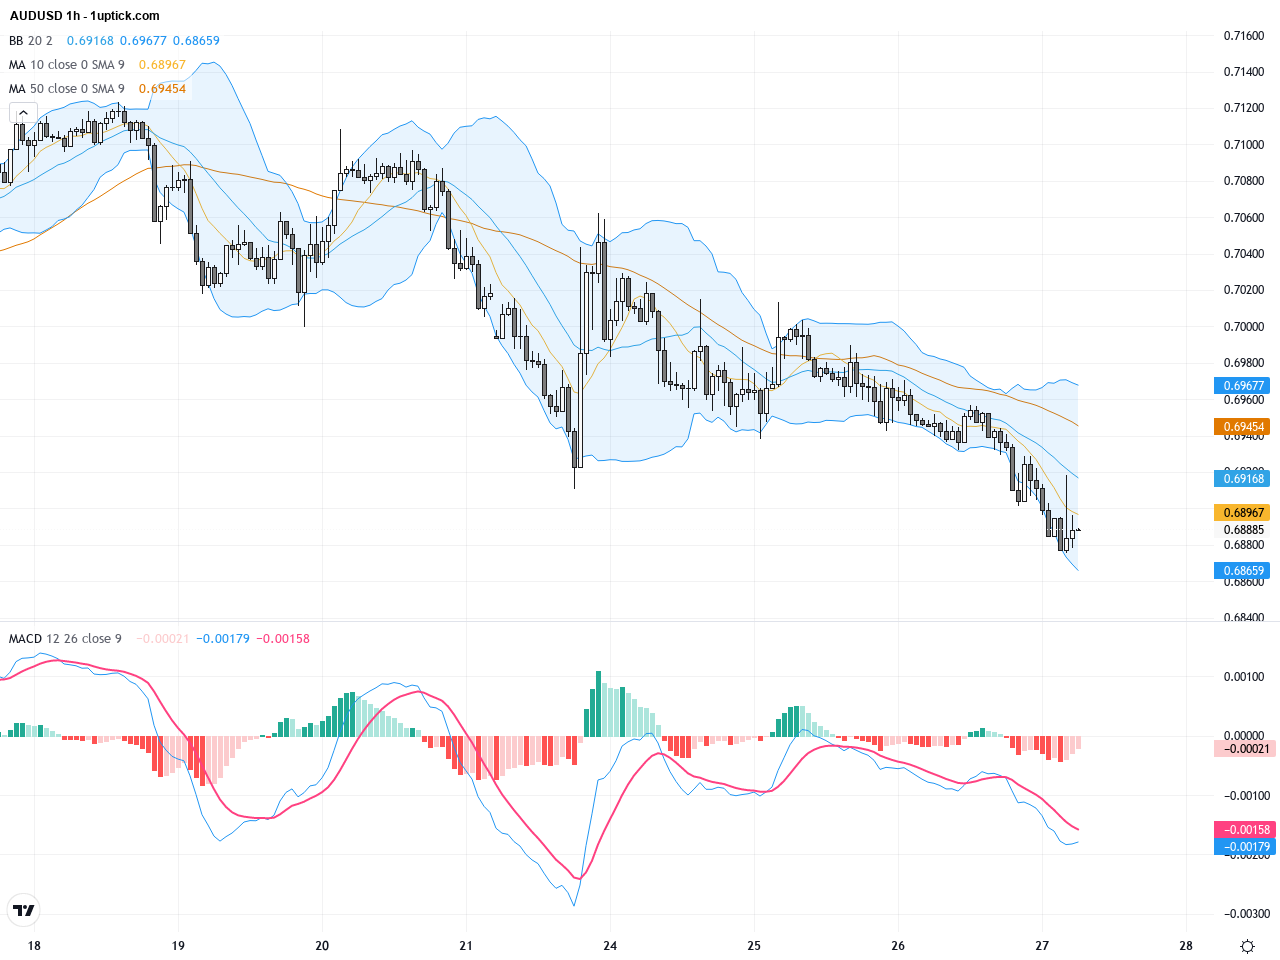
The hourly chart for the past 3-5 days reveals increased volatility within a tight range between 0.688 and 0.698. The short-term moving averages (20 and 50) are interlaced, highlighting uncertainty. Bollinger Bands contraction points to an impending breakout, while MACD remains below the signal line, confirming continued selling pressure though with a hint of potential rebound. A consolidating symmetrical triangle pattern is visible, signaling a wait for a breakout triggered by fresh catalysts.
Technical Trend: Cautiously consolidating with a watchful stance.
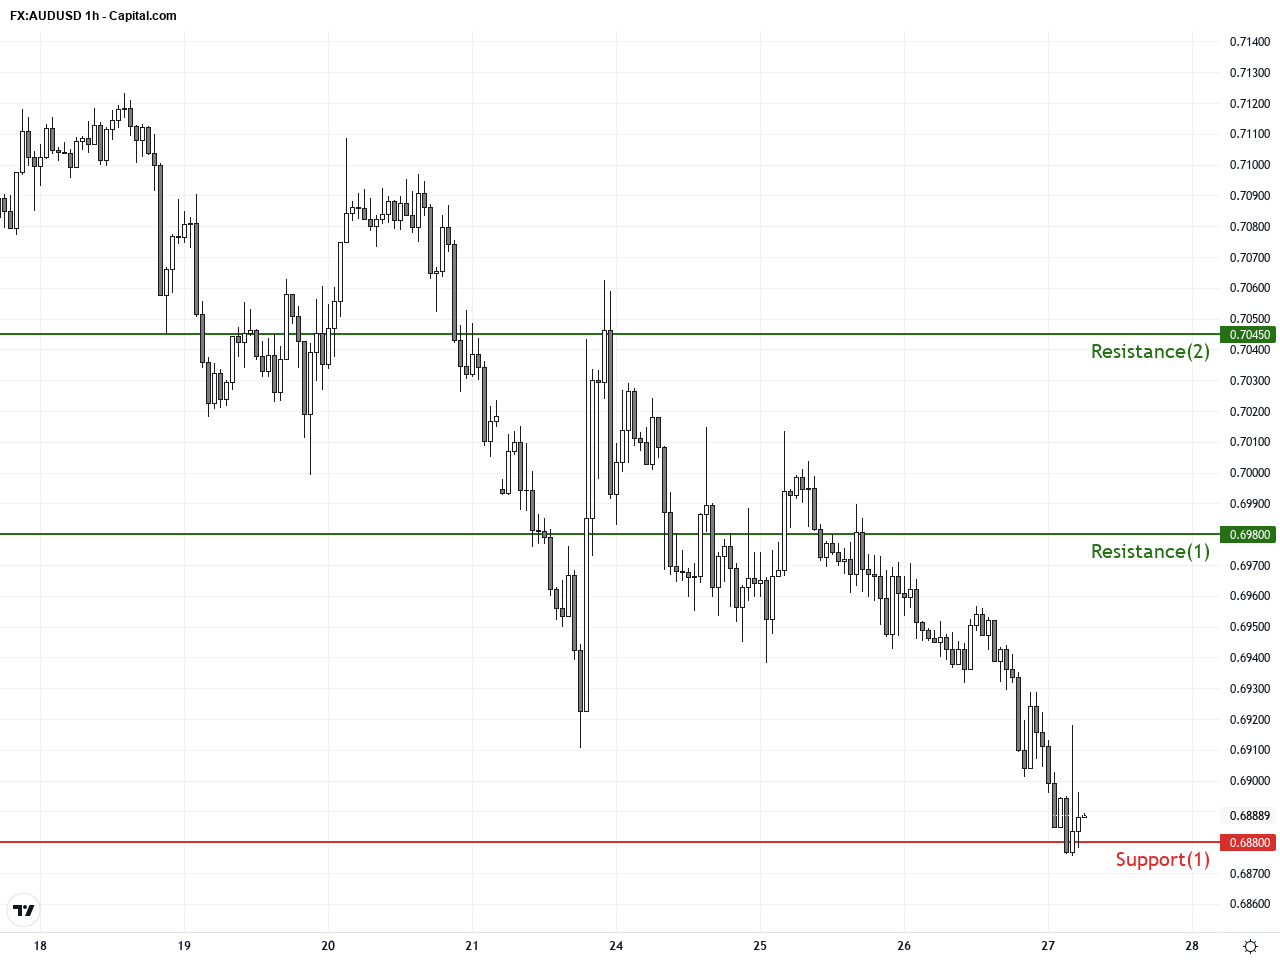
Technically, AUDUSD is coiling tightly between 0.688 and 0.698 forming a distinct triangle consolidation pattern awaiting a breakout. The MACD has yet to show a decisive signal reversal but volume and volatility constriction suggest a significant move is imminent once the breakout occurs. Support from the 200-day moving average bolsters buying confidence on dips, while losing the critical 0.688 support could signal deeper downside ahead.Today’s economic calendar features several releases primarily from Europe and the U.S., with limited direct impact on AUDUSD. Key data points to watch include U.S. weekly jobless claims and the Kansas City Fed manufacturing index, which could influence USD sentiment and indirectly affect AUDUSD. Australia has no major economic releases today, so price action will likely hinge on geopolitical developments and overall dollar strength.
Resistance & Support
The above financial market data, quotes, charts, statistics, exchange rates, news, research, analysis, buy or sell ratings, financial education, and other information are for reference only. Before making any trades based on this information, you should consult independent professional advice to verify pricing data or obtain more detailed market information. 1uptick.com should not be regarded as soliciting any subscriber or visitor to execute any trade. You are solely responsible for all of your own trading decisions.