 |
| Gold V.1.3.1 signal Telegram Channel (English) |
AUDUSD Technical & Fundamental Report: Daily Golden Cross Points to 0.7110 Resistance Break
2026-03-02 @ 06:01
Over the past 24 to 48 hours, the Australian Dollar to US Dollar (AUD/USD) has experienced notable volatility, fluctuating from yesterday’s closing price of 0.7104 to a high of 0.71321 and a low of 0.70373. This movement was primarily driven by a hawkish outlook from the Reserve Bank of Australia (RBA), with market consensus anticipating further policy tightening. The rising domestic yields have further strengthened the AUD’s appeal.
Market insights from Credit Agricole suggest the AUD could reach 0.73 before a possible pullback in the second half of the year, signaling strong buying interest amid improving yield conditions. Meanwhile, a stronger US Dollar and weaker Australian PMI data have applied short-term pressure on the AUD/USD rate, contributing to its choppy price action.
For everyday investors, this dynamic reflects how the AUD is balancing global risk sentiment and shifting interest rate policies, showing resilience and attracting carry trade strategies. This recent price action highlights a potential opportunity window for forex traders looking to leverage interest rate differentials in the near term.

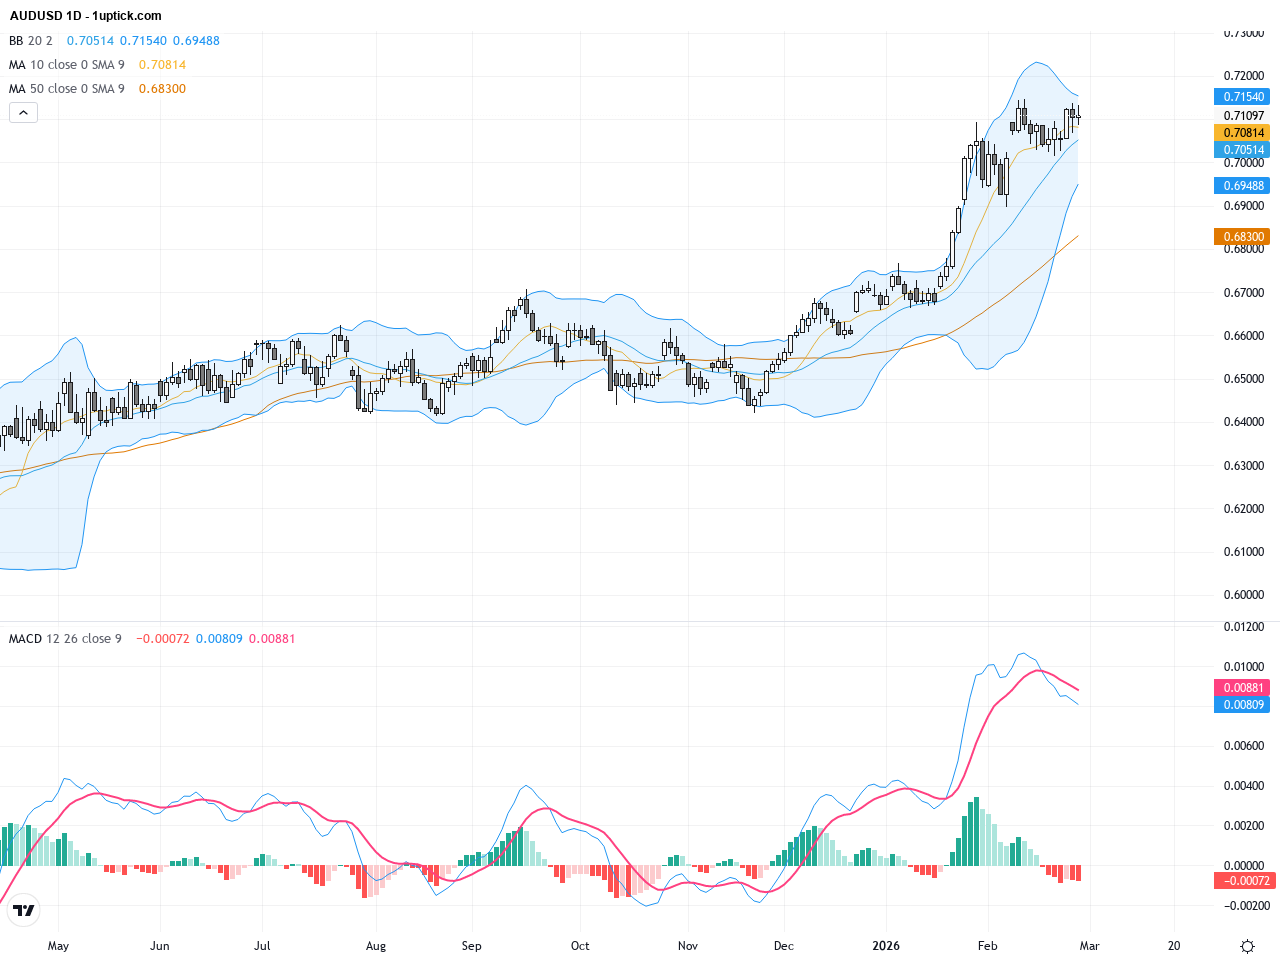
The daily chart reveals AUDUSD forming a base around the 20-day moving average with a recent golden cross indicating a strengthening medium-term bullish trend. Bollinger Bands have tightened then started to widen, suggesting increased volatility ahead. The MACD histogram’s declining negative bars and a bullish crossover confirm rising momentum. Overall, the trend is shifting from correction to moderate upward movement with immediate targets between 0.7110 and 0.7210 resistance zones.
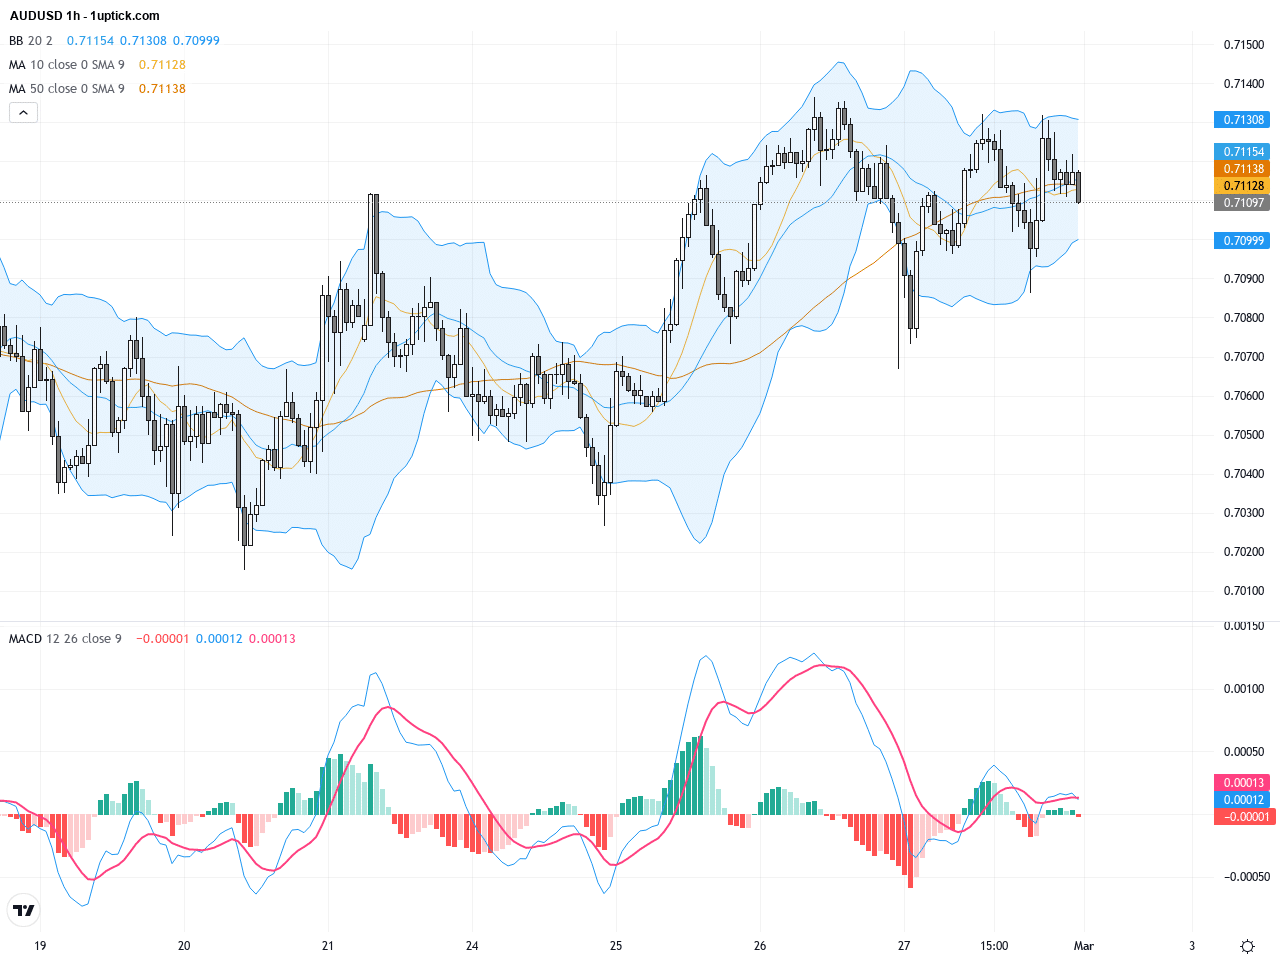
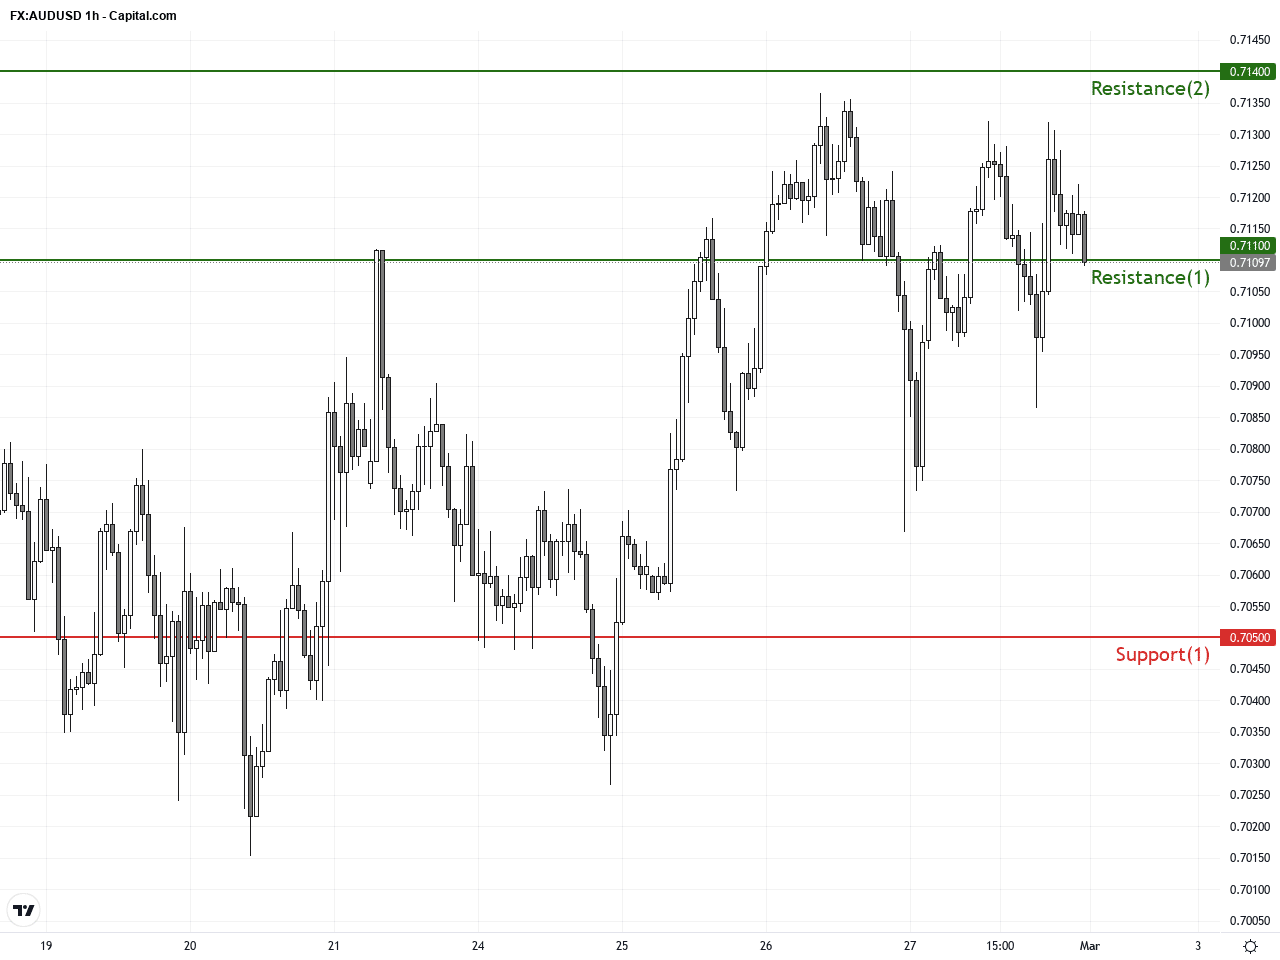
On the hourly chart covering the last 3-5 days, AUDUSD has consolidated between 0.7050 and 0.7100, repeatedly testing and holding the 20-period moving average. The MACD indicates weakening short-term bearish momentum while Bollinger Bands lower band provides support. A recent hammer candlestick signals strengthening buyer interest and suggests a potential upward breakout within the next 24 hours toward the 0.7110 resistance area.
Technical Trend: The current trend is cautiously bullish with a “steady upward” outlook. There is potential for a strong rally towards 0.7210, though investors should remain aware of volatility risks.
The key technical insight is the formation of the golden cross on the daily chart signaling further bullish momentum, with the 20-day SMA acting as critical support. The hammer pattern on the hourly chart indicates a short-term bullish reversal supported by improved buyer pressure. Watch the 0.7110 resistance level for a breakout that could offer a high-probability trade entry, confirmed by strengthening MACD momentum.Today’s GMT+1 16:00 event features Bundesbank Chairman Nagel speaking. Given the focus on European economic matters, this event has minimal direct impact on AUDUSD, which is more sensitive to Australian and US data. Therefore, no major scheduled economic event today is expected to move AUDUSD significantly. Traders should watch upcoming Australian CPI figures and US FOMC minutes for clearer directional cues.
Resistance & Support
The above financial market data, quotes, charts, statistics, exchange rates, news, research, analysis, buy or sell ratings, financial education, and other information are for reference only. Before making any trades based on this information, you should consult independent professional advice to verify pricing data or obtain more detailed market information. 1uptick.com should not be regarded as soliciting any subscriber or visitor to execute any trade. You are solely responsible for all of your own trading decisions.