


 |
| Gold V.1.3.1 signal Telegram Channel (English) |

EURUSD: Critical Support Tested Ahead of Fed Rate Decision Amid Volatility
2026-03-18 @ 09:02
Over the past 24 to 48 hours, EUR/USD fluctuated mildly between 1.1532 and 1.1546, closing at 1.15328, slightly down from yesterday’s close. Market attention has been focused on the imminent Fed interest rate decision, with a softer US Dollar lending support to the euro’s modest gains. Recent declines in US Treasury yields alongside improved housing market data have further reduced the dollar’s appeal, supporting the euro exchange rate.
However, elevated energy prices in Europe and ongoing geopolitical tensions have kept investors cautious, resulting in heightened volatility with EUR/USD touching a seven-month low recently. Expectations of steady US inflation, as indicated by upcoming CPI data, also create divergent views on the Fed’s policy outlook, adding to market uncertainty. For average investors, this period represents a tug-of-war between macroeconomic and policy factors that are shaping the euro against the dollar.
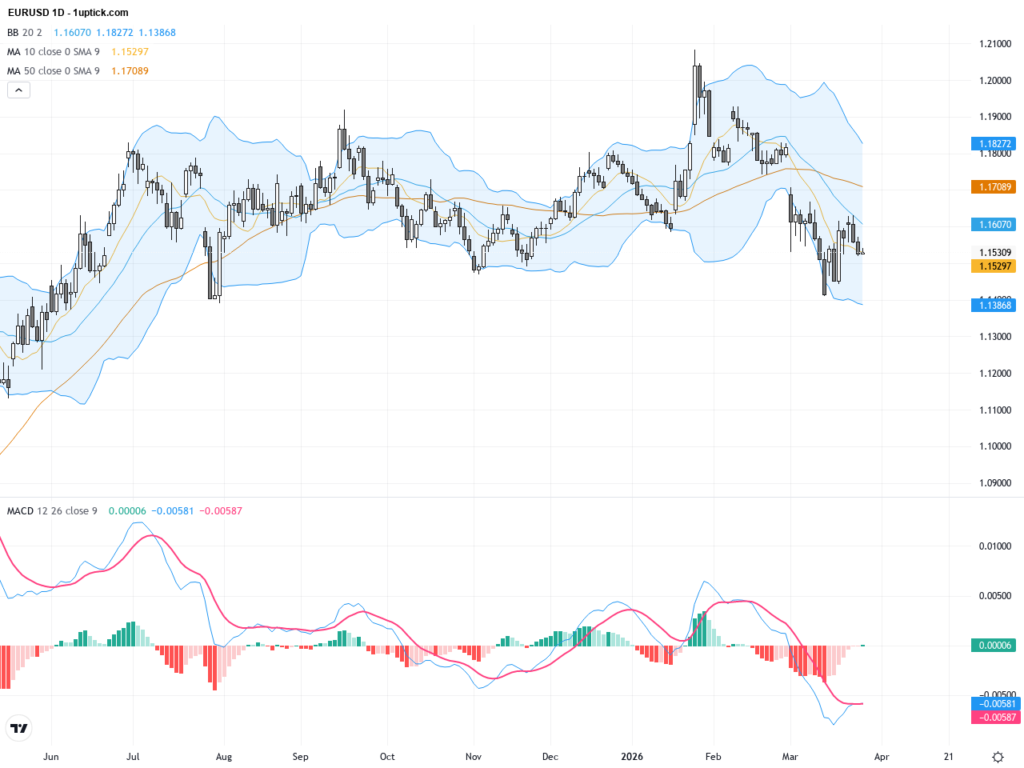
The daily chart reveals a consistent downtrend for EURUSD, declining from a year-to-date high around 1.2080 to the current levels near 1.153. The pair trades below the 50-day moving average, and has recently dipped below the 200-day moving average (approx. 1.16824), reinforcing bearish sentiment. Bollinger Bands are contracting, suggesting a period of lower volatility, but a breach below key support could accelerate selling pressure. The MACD histogram remains in negative territory, with the signal line indicating sustained momentum to the downside. This technical setup points to a dominant bearish trend over the medium term.
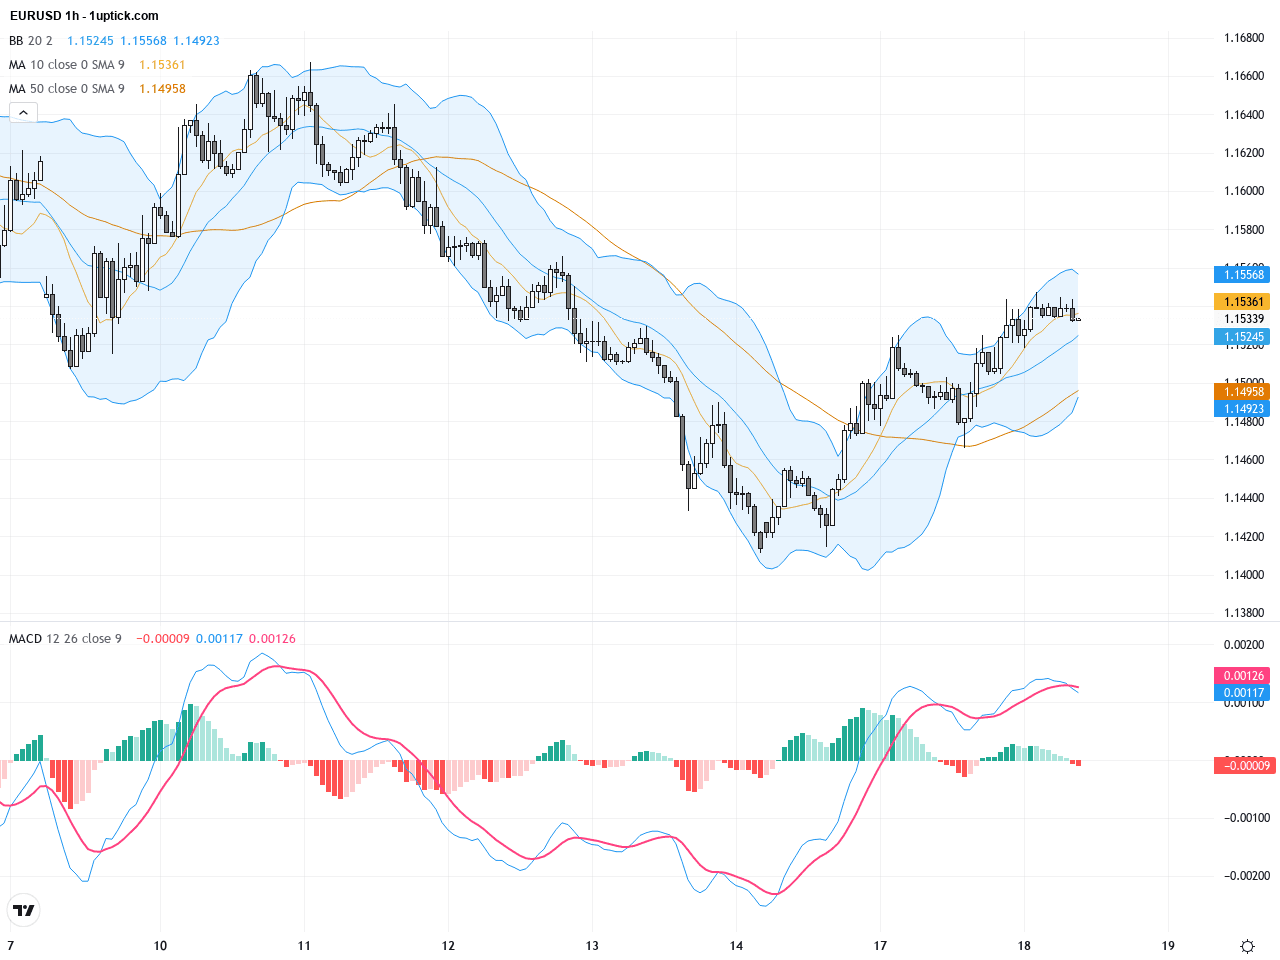
On the hourly chart reflecting the past 3-5 days, EURUSD exhibits increased short-term volatility, trading within a tight 1.153 to 1.160 range. A converging triangle pattern is apparent, indicating equilibrium between buyers and sellers. The 20- and 50-hour moving averages are interwoven, while Bollinger Bands narrow, signaling potential for a breakout. The MACD lines are approaching a bullish crossover, and a recent hammer candlestick near support reflects short-term buying interest. Traders should watch for a break above the triangle’s upper trendline as a potential bullish signal or a break below support indicating continuation of the downtrend.
Technical Trend: The current EURUSD trend is cautiously bearish with sideways consolidation, reflecting market uncertainty as traders await the Fed rate decision.
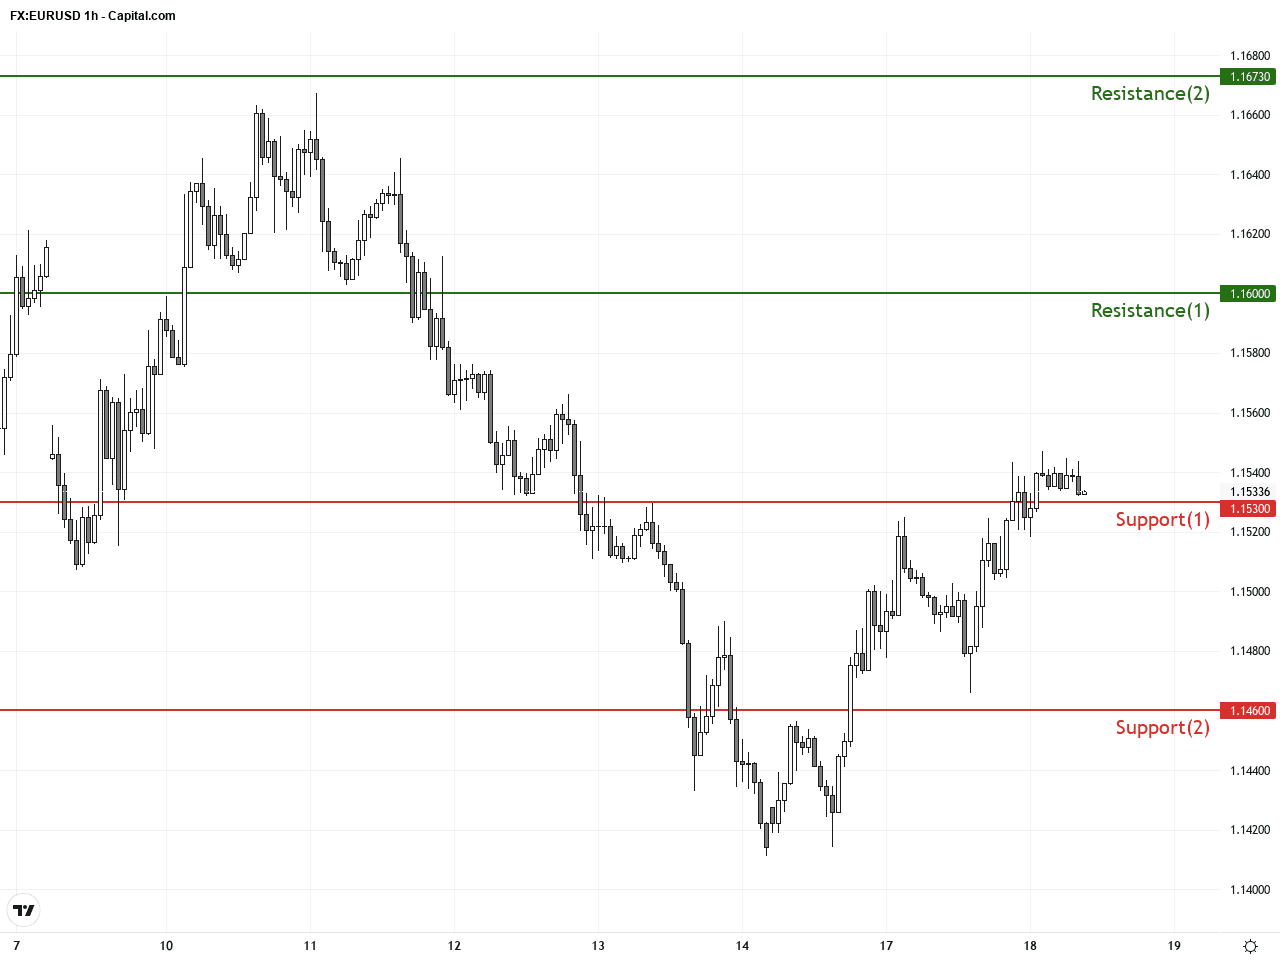
Technically, EURUSD is testing critical long-term support near 1.1530. The daily chart’s downtrend is confirmed by moving averages and bearish MACD, while the hourly chart signals potential short-term retracement with a hammer candlestick and an approaching MACD bullish crossover. This blend of signals suggests the market is in a wait-and-see mode ahead of key data releases. A confirmed break below 1.1530 could open the door to further downside towards 1.1460 and 1.1400 levels. Conversely, a rebound and breakout above 1.1600 could signal renewed upward momentum.Today’s economic calendar (GMT+1) highlights several key releases affecting EURUSD. At 11:00, the Eurozone publishes its February Harmonised Index of Consumer Prices (HICP) preliminary and core figures, expected to tick higher and potentially support the euro. The most impactful event is the US Federal Reserve interest rate decision at 19:00, followed by the FOMC press conference at 19:30. These US announcements will heavily influence the US dollar’s strength and thus EURUSD price action. Early Japanese trade data have limited effect on EURUSD. Overall, traders should prepare for significant EURUSD volatility post-Fed events.
Resistance & Support
The above financial market data, quotes, charts, statistics, exchange rates, news, research, analysis, buy or sell ratings, financial education, and other information are for reference only. Before making any trades based on this information, you should consult independent professional advice to verify pricing data or obtain more detailed market information. 1uptick.com should not be regarded as soliciting any subscriber or visitor to execute any trade. You are solely responsible for all of your own trading decisions.