 |
| Gold V.1.3.1 signal Telegram Channel (English) |
EURUSD: Key Resistance and Support Levels Amid Energy Risk and Fed-ECB Policy Tug of War
2026-03-27 @ 09:01
Over the past 24 to 48 hours, the EUR/USD pair demonstrated notable volatility, slightly climbing from yesterday’s closing price of 1.15307 to around the 1.16 mark in early trading today. This rise was primarily driven by easing geopolitical tensions, where a logical skepticism for peace led to reinforced support for the US Dollar’s petrodollar status, influencing overall price fluctuations.
According to recent market news, the US withdrawal from the Middle East has sparked concerns over the stability of the petrodollar system, especially after Iran rejected the US 15-point peace plan, which in turn drove oil prices higher and increased uncertainty. However, with geopolitical pressures easing, the euro rebounded against the dollar, reflecting increased short-term demand for the euro among investors.
For the average investor, this scenario resembles a pause for breath amid ongoing international tensions; a glimmer of peace brought a temporary rebound in the exchange rate. Yet, pressures from rising oil prices and a strong dollar remain, signaling that volatility and risks are still present. The modest rise in EUR/USD highlights the market’s cautious optimism toward stability while waiting for clearer policy directions.

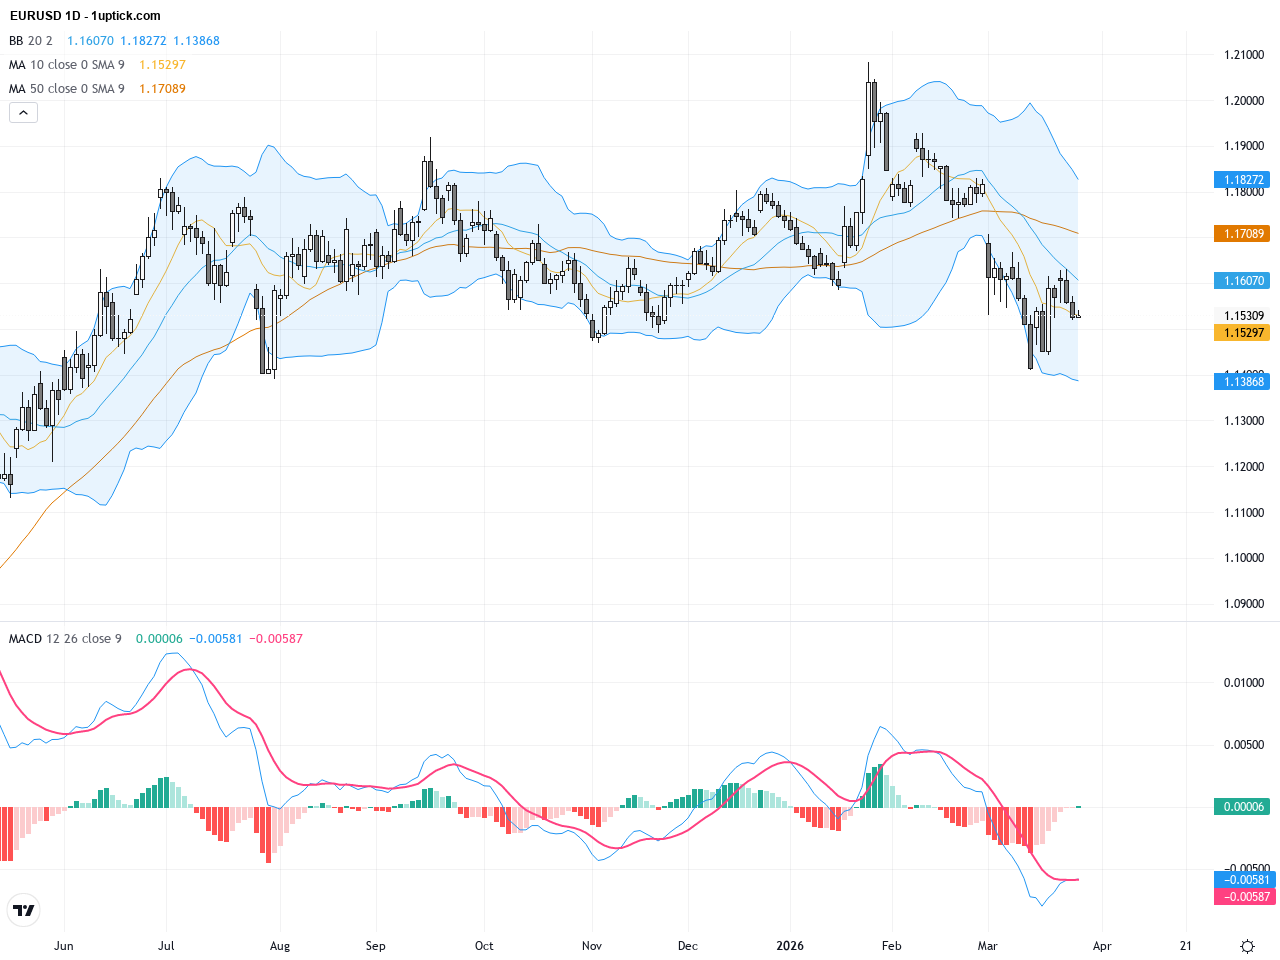
The EURUSD daily chart shows a downtrend from the recent high near 1.1639, with prices oscillating between 1.15 and 1.16. The pair trades below its 50-day (around 1.1726) and 200-day (around 1.1683) moving averages indicating medium-term bearish pressure. Bollinger Bands are narrowing suggesting lower volatility, while MACD remains in negative territory signaling weak momentum. Overall, the daily trend continues downward with repeated tests of support zones and no strong reversal signals yet.
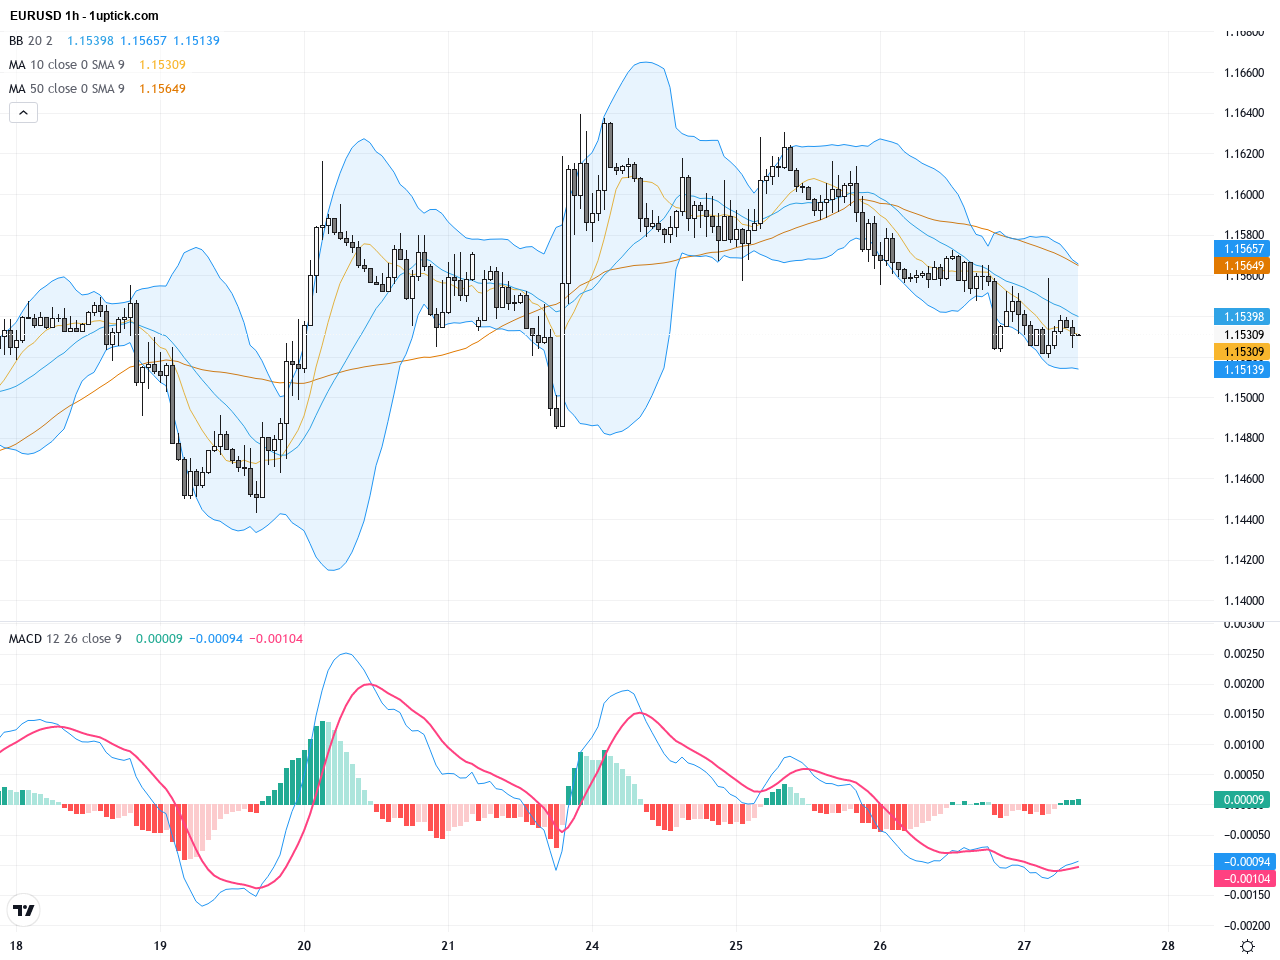
The hourly chart over the last 3-5 days reveals a clear zigzag downtrend with prices hovering near the 1.153 support level. Multiple tests of around 1.1525 support without a breakout have resulted in short-term consolidation. Moving averages are intertwined, and MACD shows signs of an impending bullish crossover. A recent hammer candlestick near support hints at a possible rebound but requires volume confirmation and further price action to validate.
Technical Trend: Cautious Consolidation
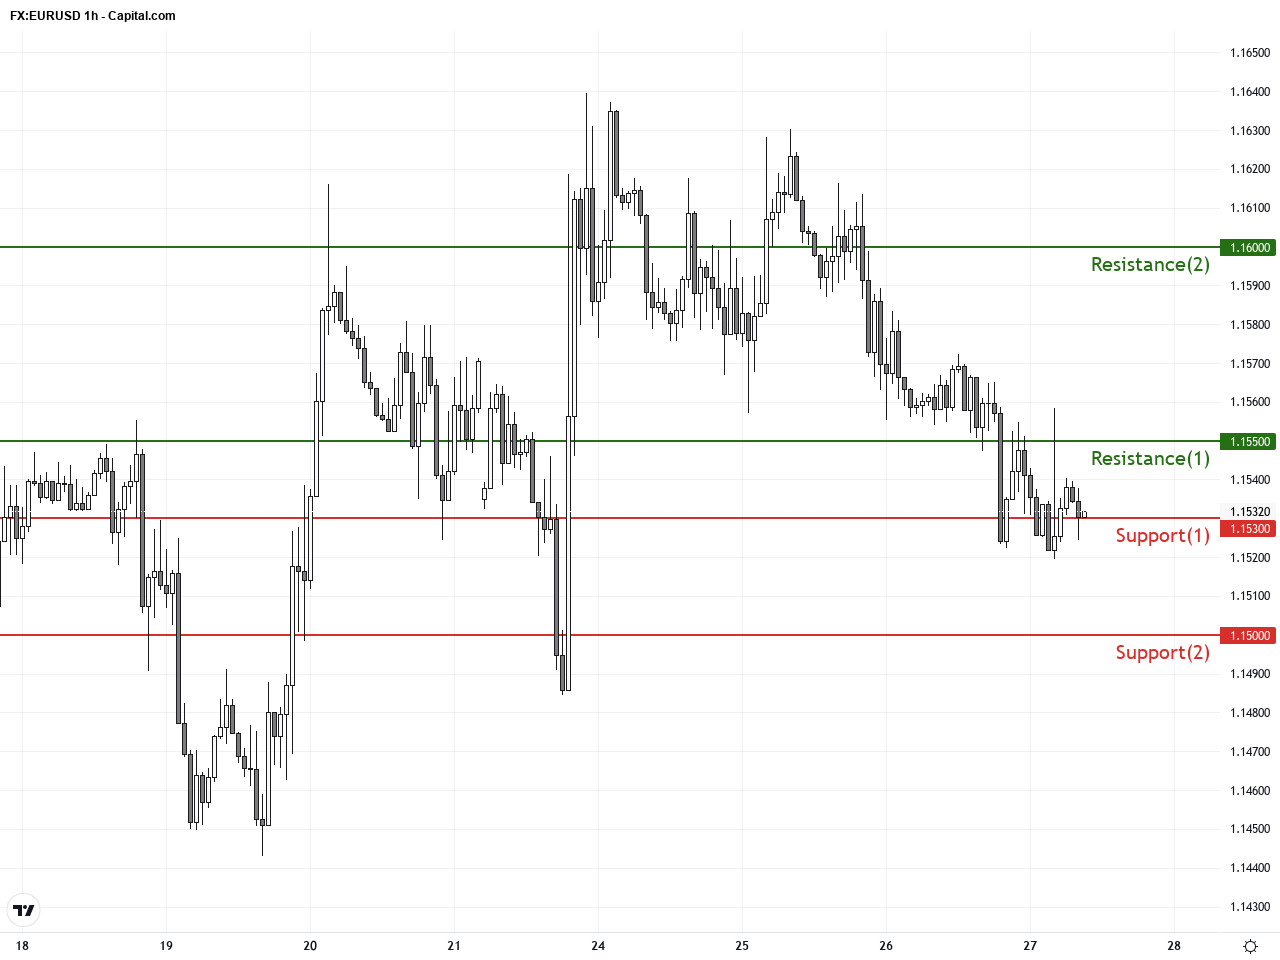
Technically, the daily chart shows clear downside pressure with key dynamic resistance at the 50-day and 200-day moving averages. On the hourly chart, the pair consolidates near support with MACD and RSI indicators suggesting a possible short-term bounce. The recent hammer candlestick near support signals a potential short-term buy setup, contingent on a break above 1.1550 to confirm bullish momentum. Volume patterns highlight a key inflection zone. EURUSD currently sits at a pivotal technical juncture with increased short-term volatility but no confirmed trend reversal.Today’s economic calendar features the Eurogroup Meeting which, while lacking specific data releases, could provide policy cues relevant to EURUSD. Multiple speeches from FOMC members are scheduled, potentially influencing Fed rate expectations. Spain is slated to release preliminary consumer price index data; higher-than-expected inflation may put additional pressure on the euro. Overall, there are no major direct economic events expected to impact EURUSD today, but political developments and policy statements could trigger short-term volatility.
Resistance & Support
The above financial market data, quotes, charts, statistics, exchange rates, news, research, analysis, buy or sell ratings, financial education, and other information are for reference only. Before making any trades based on this information, you should consult independent professional advice to verify pricing data or obtain more detailed market information. 1uptick.com should not be regarded as soliciting any subscriber or visitor to execute any trade. You are solely responsible for all of your own trading decisions.